Special contribution by Amit Tal (@amital13):
The relationship between the capital market line model, the amount of debt, inflation expectations, and the rise in the price of assets worldwide.
Introduction
One of the main problems in the world in recent times is high asset prices (stock indices, real estate prices, and food prices at an all-time high), a phenomenon that is widely shared by many markets around the world.
The process of rising property prices is a result of a complete lack of understanding of the implications of the Keynesian method, political events in the 1970s and the evolution of the Phillips Curve, which found a positive correlation between inflation and the labor market.
The purpose of the article is an attempt to explain the behavior of record-breaking stock indices, and its conclusion is that we are in a self-sustaining bubble that necessitates a continued rapid increase in assets. The alternative to this process is the total paralysis of the global economy and the creation of social chaos.
Historical background
The “Great Depression” of the 1930s left harsh feelings among economists in those years. This depression was the longest and most difficult in the history of the United States. The depression began in 1929, and lasted more than a decade, until the United States entered World War II. The Depression reached its peak in 1933 with a 60% fall in gross national product, a decline of about 80% in industrial output, unemployment of about 25%, and over 9,000 bankruptcies.
Following that traumatic crisis, John Maynard Keynes, a British economist, wrote his economic theory in the book Economic Theory of Employment, Interest and Money. This book caused a great deal of change among economists, who saw this theory as a revolution. Keynes argued that the relative rate of savings in the economy increases with the rise in the level of income, while the increase in investments reduces the increase in savings. The funds used as savings reduce the general purchasing power of the economy, and therefore there is a relative lag in the demand for goods and services, although in absolute numbers this demand is rising. Surplus supply creates a state of imbalance, and with it, unemployment increases.
According to Keynes, the only way out of a crisis situations, in which the supply-to-demand balance is not in full employment, is government intervention. Keynes argued that the government should create a deficit and invest money in infrastructure. That same government investment will trigger a re-start of the economy.
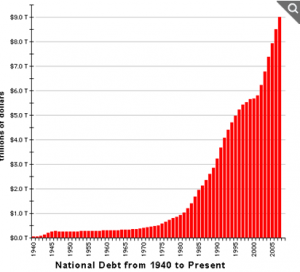
The adoption of Keynes’ approach led to a significant increase in the level of US debt relative to previous years. The assumptions of the Keynesian model were used in later periods for the development of the Phillips Curve, which states that the inverse relationship between the unemployment rate and inflation rate caused economists to defend inflation.
Cancelling the gold standard
In 1971, the gold standard was cancelled as a basis for the dollar by US President Nixon. The background to the decision was an increase in the trade deficit and an increase in the budget deficit following the Vietnam War. The decision made it possible for the governments of the USA to increase state debt considerably.
Figure 1 – Federal government debt in the United States
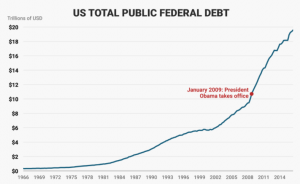
Figure 2- Federal government debt.
Capm model (Capital Market Line)
The model is based on two central equations. One of them is the market line equation(CML). This equation shows the relationship between the expected excess yields on an investment portfolio, which results from the distribution of investments between a risk-free asset and the portfolio’s risk, which is expressed in its standard deviation.
A risk-free asset according to the model is government bonds.

Debt bubbles
In the 50 years since the US decided to cancel the gold standard, and following the easing of credit in the 1980s, the amount of global debt began to grow considerably.
I want to illustrate how the mechanism of credit bubbles works, in my opinion. I will do it with parallels between all economic agents and markets (government, companies, households) and the average citizen. For example, let’s say that a person is interested in taking a loan and when the time comes and he or she has to pay the bank, the person doesn’t have the financial possibility at the moment. The person faces two options: bankruptcy or a bigger loan on more favorable term (lower interest rate). In the past 45 years, all markets have preferred the second option.
This line of reasoning explains the behavior of interest rates in recent decades. In addition, whenever the interest rate rises, a crisis arises.
Figure 3- the yield of USA government bonds.
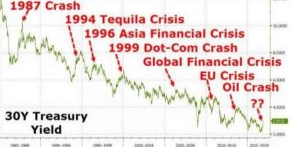
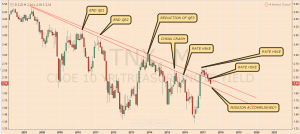
Is there a chance that central banks know this and try to do everything in their hands to prevent this explosion? A look at the bond market proves so.
Figure 4- Fed behavior in recent year.
A combination of the market line equation and the debt bubble
Let’s look at the equation that composes the market line

Risk-free interest is decreasing, as we understood from the debt bubble process. In order to maintain the same expectation of the portfolio investor must increase the risk in the portfolio (standard deviation of the normal).
Increasing the risk involves at some stage the taking of loans that are invested in the market. This increases the debt bubble and requires further lowering interest rates.
And so we are in an endless loop of risk-taking, price increases of self-sustaining assets.
This line of thought explains this graph
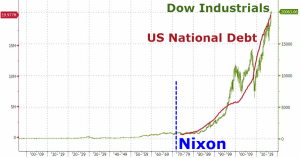
Figure 5- market vs debt
Is there an alternative?
In my opinion, the alternative is much worse and would be the explosion of this credit bubble, which could lead to total chaos in the market. This behavior of markets must continue. The problem will arise when the middle class collapses.
This is a contribution by Amit Tal @amital13
My response:
I explain alternative solutions in my book Escape from the Central Bank Trap.
It is undoubtable that the perennial increase in debt that governments have implemented requires what Keynesians call “moderate inflation”. The fact that the modern capitalist economy post-Bretton Woods has become a credit economy where all economic agents add more debt expecting asset prices to rise is also a fact.
However, as we have exceeded the point of debt saturation, we go from productive debt to unproductive and dangerous debt, creating weak growth and declining productivity. This makes monetary policy create abnormal price inflation and, at the same time, a disproportionate amount of debt exposed to financial assets (margin debt).
So the objective of central banks and monetary policy must be to prevent bubbles bursting into a massive financial crisis, given that the possibility of returning to full sound money policy is virtually impossible. Therefore, we can introduce limits to monetary policy in order to avoid the constant boom and bust cycles. There are numerous articles in this website about this subject if you want to expand.
I hope you enjoy Escape from the Central Bank Trap, the details are all there.
Daniel Lacalle is Chief Economist at Tressis SV, has a PhD in Economics and is author of “Escape from the Central Bank Trap”, “Life In The Financial Markets” and “The Energy World Is Flat” (Wiley)
Images courtesy Google Images, zero hedge, and Amit Tal.


