Here is the response from a reader, Rich Lyon, to my analysis of peak oil (http://energyandmoney.blogspot.com/2009/11/peak-oil-realities-myth-and-risk.html):Ref: “Also, 60% of world oil production declines from 1.5 to 2.5% annually”
Rich says “May I draw your attention to IEA’s World Energy Outlook 2008 p.244 “It is necessary to estimate the underlying, or natural decline rate — the rate at which production at a field would decline in the absence of any investment — in order to ascertain how much capital needs to be deployed to sustain production or limit observed decline to a particular rate…The production-weighted average annual natural decline rate for the world as a whole is estimated at 9.0% — some 2.3 percentage points higher than the observed decline rate…At the world level, the increase in the production-weighted average decline rate over the projection period is about 1.5 percentage points, taking the rate to around 10.5% per year in 2030. That’s a halving rate of 7 years. Against any criticism you might make of the IEA, even CERA concedes 4.5% – a 15 year halving time. Schlumberger CEO used 8% in an internal newsletter.”
My answer: If I take the top producing projects globally the decline rate dropped from 4.5% to 3% between 2003 and 2010. Added to the improvement in recovery rate seen in Russia we achieve a 2% annual decline. It’s documented in our analysis of the main fields and in Goldman Sachs Top 330 projects as well. Schlumberger, like any oil service company, benefits from decline by taking more projects and increasing engineering. Their analysis might be interesting but not conclusive.
Goldman’s analysis of the industry’s new legacy assets has grown from 91 bnboe in Top 50 Projects (June 2003) to 565 bnboe in Top 330 Projects. They estimate that these projects will deliver around 62 mnboe/d of production by 2020E (46% of current global oil and gas production)
In the Top 360 Project report (2012) decline rates are analyzed:
Decline rates have changed dramatically in the non-OPEC supply base over the past ten years and our forecasts. These declines are calculated by subtracting major new start-ups (Top 360 projects) from historical production, to estimate the base decline including enhanced oil recovery, satellites and small field developments. It is interesting to see that since 2008 the decline rates have improved and stabilized around 2.0%. This is the result, in our view, of increased spending on the production base and of debottlenecking of the service capacity.
Source of graphs above and below: Exxon
Exxon, who are well known for being prudent and conservative, sees 2010-2040 global oil & gas supply: +5.3% pa (unconventional), +4.8% pa (heavy/oil sands), +3.5% pa (LNG), +2.8% pa (deepwater) and +0.3% pa (conventional)
Ref: “but global investments between $720 and $750 billion a year in oil and gas have also seen an unprecedented discovery and addition rate”
Rich says “In fact a perfectly good precedent exists – the discovery rate that was achieved in the period between 1940 and 1970, when global discovery rate rose from 5 billion barrels per year to 55 billion barrels per year. The rate of discovery peaked in 1968 and has followed a consistent 5% per annum decline rate ever since, punctuated by the isolated basin discoveries of Prudoe Bay and the North Sea, the recapitalisation of the FSU, and the modest (and now declining) contribution from deep water technology. It is perfectly straightforward to work out what discovery rate would be necessary to sustain 1.5% demand growth – about three North Seas every five years, commencing ten years ago. As it happens, that is the same discovery rate as they achieved 1940-1970. And, as it happens, the “unprecedented discovery rate” to which you allude is a pale fraction of that”.
My answer: The chart shows two distinct flaws. First, a 5% decline, and a 1.65% pa growth of demand.
Let’s start with discoveries. An average of 3 bnbls of oil were discovered each year in 2003-05, vs.8 bnbls in the 2006-09 period (IEA, Goldman, CERA) .Most of the discoveries over the last five years have been made in the deep offshore, with Brazil dominating on size, followed by the Gulf of Mexico and Ghana. Onshore discoveries of large size have been rare and in general limited to Iraq (Kurdistan) and Uganda, although oil shales and field redevelopments in Iraq have provided very material additions to the pipeline of onshore oil projects .
Additionally, the old trend of delivery with only c.75% of the promised volumes delivered after five years has massively changed and a new trend of c.95% was identified 2005-2010 (Goldman). This proves that the “below to above ground” analysis of many peak oil defenders is not linear and that industry technology and delivery has massively improved.
The analysis you mention focuses only on conventional oil as we knew it in the late 90s… why? Not clear. Why don’t we disregard any oil that is not onshore Saudi Arabia? why not disregard any oil that is not API perfect?. Very much in line with most peak oil theories, the analysis you ention completely forgets non-conventional and liquids as “inexistent”. Just the addition of shale oil resources and heavy oil in Venezuela and Iran have brought reserve replacement well above 120%. In addition to that, the giant discoveries in West Africa have added to the base of low sulphur crude.
To ignore non-conventional, pre-salt and heavy oil would be the same as ignoring deep water in 1970, or ignoring oil sands in the 80s. Drivers and motorists do not make that distinction as it’s as valid (if not better, given the excess capacity at high complexity refineries of 8mmbpd there is plenty of processing available at cheap cost) as a fuel as anything else. And EROEI analysis is available in this blog as well here http://energyandmoney.blogspot.com/2011/06/peak-oil-defenders-most-overlooked-myth.html.
Further read from Robin Mills: http://www.thenational.ae/thenationalconversation/industry-insights/energy/flawed-views-on-peak-oil-rear-their-ugly-heads-again
Ref: Inability of the oil industry to catch up with “growing demand”
Rich points to this chart:
My answer: The first thing I will question, as I have since 2003, is that “perennial growth of demand” of 1.6%pa. Demand moves in cycles and is not uniform. The lack of understanding of demand cycles and ignoring fuel efficiency as it happens is a key driver of the perception of scarce supply.
I am a firm believer of peak oil…demand. The assumption that demand growth will be linear and exponential and that the millions of new inhabitants of the world will consume as many barrels of oil per day as the Americans is simply impossible. First, efficiency continues to drive the transport industry, second, new technologies and alternative energies create a completely different scenario. We have not even talked of natural gas vehicles, but the reality is that when emerging markets reach the level of maturity in their economies that the OECD has, average oil consumption per capita in those countries will also be well below the current US-EU level. In our calculations average oil consumption per capita declines by 6%pa due to efficiency and alternatives:
a) IEA long-term demand estimates have only been going down since 2005.
b) Growth of demand in Asia and EM is mostly offset by OECD decline, and the added growth is slowing down, as evidenced in China. More importantly, the “China angle” assumes that every city in China will consume 23bpd per capita. This is overstated by the fact that all major cities in China consume already that figure, and it’s slowing down, and like in Europe you cannot assume that the inhabitants of South Spain will consume as much as the Madrid citizens. It’s not an averaging up to the maximum, it’s an averaging down, as evidenced by efficiency impact in the US, where GDP grew 3% pa for a decade without a meaningful increase in power demand. Oil demand in the US went from 15mbpd to 18mbpd (a mere 3mmpd increase) in the period of highest GDP growth and monetary expansion (1970-2011).
Hi Daniel – I note your trick in the Saudi graph of starting the y axis at 6 rather than zero to exaggerate the appearance of an increase – a common statistical illusion. Saudi has about 15 million barrels a day of production capacity and 10 million export capacity – recent exports of 8 merely reflect demand stagnation, and your “rocketing” exports is in fact it reverting to its saturated maximum output.
Of far more interest is the erosion of export capacity by soaring internal demand, driven by Saudi population growth compounding rising cooling and water desalination power requirements. Saudi export capacity in fact falls to zero by 2030. Which is why Saudi is commissioning 16 nuclear power stations a conventional missile strike away from Iran and Israel. Details for your more curious readers here: http://richardlyon.net/blog/2012/02/10/end-saudi-production/
Also, on Saudi Arabia’s exportable capacity, the assumption of exponential demand growth in my view is also questionable. Saudi Arabia already consumes oil above the per-capita demand of many OECD countries. Efficiency will also erode that exponential growth and you will likely see solar, gas and nuclear be added to the energy mix not due to “lack of capacity” but driven by a logical generation mix planning, just like the mix we have in most countries. Saudi Arabia is expected to increase electricity generation capacity to 80 gigawatts, driving primary energy intensity from 257 (EU=100) to 150 by 2020. The efficiency of the power sector (thermal power plants) has regularly increased over the period 1990-2009, rising from 27
percent to 31 percent. I personally have Saudi Arabia peaking its oil consumption in 2015. More in detail, I see demand in The Kingdom going from 83.73 bbl/day per 1,000 people to 68 by 2020, still a high EU-type of consumption per capita.
Here is my interview on CNBC:
http://video.cnbc.com/gallery/?video=3000076989
Further read:
http://oilprice.com/Energy/Crude-Oil/Why-is-Obama-Lying-About-US-Oil-Reserves.html
http://www.businessweek.com/magazine/everything-you-know-about-peak-oil-is-wrong-01262012.html
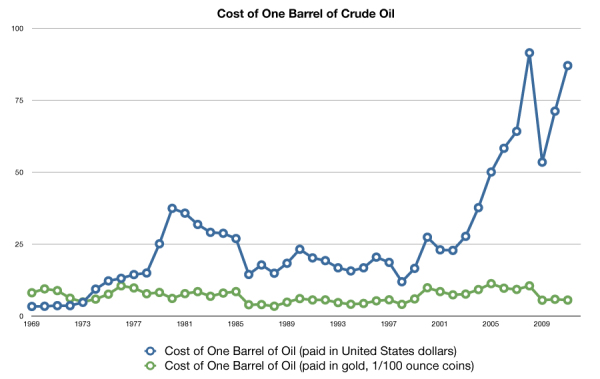
They might cite the idea that oil prices are much higher than they were ten years ago. Yet this is mostly a monetary phenomenon resulting from excessive money creation beyond the economy’s productive capacity. Priced in gold, oil is still very cheap — almost as cheap as it has ever been:
cartierbraceletlove Okay, I understand the posters defending Katherine for saying how many kids she would like to have. It is a rather benign thing to say so I’m not sure why it inspired negative comments.
diamond cartier love bracelet fake http://www.stainleesteelbracelet.com/cartier-unisex-love-bracelet-rose-gold/