 @dlacalle_IA
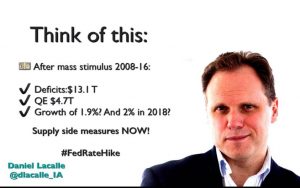
Yesterday, Janet Yellen, Chairman of the Federal Reserve, announced an increase in interest rates of 25bps, the second time in a decade, and expecting three more rate hikes in 2017. At a continued rate of +25 bps per year, it will take the US nearly 10 more years to get back to a 3% Fed funds rate.
Let us remember what was promised to support the massive stimulus plan:
The White House predicted an average growth in the economy of 4-4.5 percent, unemployment would drop to 5 percent, and the budget deficit would shrink to a mere 3.5 percent of GDP.
During the Obama administration and the massive expansionary poilicies of three QEs and ultra-low rates, economic growth was a mere average of 1.4%, 2.1% if we exclude 2009. That compares to an average 3.5% with Reagan, 3.9% with Clinton and 2.1% with Bush Jr (average annual GDP growth).
The recovery growth gap compared to other recoveries since 196o has been set at $1.67 trillion. That means the weakest recovery in recent history, as well as an economic growth that has stalled at almost half of the promise. Average The Federal Reserve expects 1.9% growth for 2016 going to 2% in 2018, the weakest relative to potential and previous recoveries.
All of this is after a massive $4.7 trillion monetary stimulus and $10 trillion in new debt (a fiscal deficit increase of $13 trillion at State, local and Federal level). Public debt ballooned from 48% to 75% of GDP. Average annual deficit was 5.2% and for 2016 it is expected to be 3.2%.
Quantitative easing was launched under four premises. Provide liquidity to reduce the risk of contagion after the financial crisis, add jobs, inflation and growth.
Its first objective was clear and worked. Unfortunately it went from solving a problem of liquidity to creating the largest bubble in financial history. High yield bonds at the lowest interest rate seen in 35 years, and stocks at all-time highs, exceeding fundamental valuations and real earnings growth.
But job creation was a success. Was it not?. 4.6% unemployment! 9.3 million jobs created. Being good, and to deny it is ridiculous, employment figures are far from what is expected of the world´s leading economy after a $ 24.7 trillion fiscal and monetary stimulus. Under Reagan 12.6 million jobs were created. Under Clinton, 21 million. Even with the massive crisis, Bush Jr saw 5.7 million in job creation.
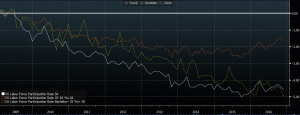
On the one hand, more than 11 million people are out of the labor force, leaving the labour participation rate at 1978 levels, and it is completely false to say that it is explained by demographics. The US has a similar demographics as the UK and labor force participation is almost ten points lower. In addition, labour force participation rate has fallen in almost all segments of age (very important between 25 and 54 years).

In October 2016 425,000 workers left the labour force, the highest level of the historical series, reaching a total of 94.6 million working age Americans that are not participating in the system or looking for a job. That shows a labour participation rate of 62.8%, not seen since 1978. In addition, the number of US citizens who supplement their income with food stamps has doubled from 20 million to more than 40.
Temporary employment stands at 18.2% (less than 35 hours per week), ie considered recessionary levels. In times of growth, the US has always had a 16.6% lower temporary rate. In the recession of 2001 it was 17% and in 2008 the maximum was 20%. With the biggest stimulus in history, it has only been reduced slightly to 18.2% even with the aforementioned poor labour participation.
Since 2009, doubling the debt, the average household income in the US has fallen in all segments (the median of $ 55,000 to $ 54,000 and the poorest segment from $ 13,000 to $ 12,000) and real wages continue to be at 2008 levels.
To top it all, in the last five years, the US annual productivity growth has been 0.6% on average, the poorest since 1978.
Inflation expectations have also been consistenly revised down throughout the period. In fact inflation expectations have only come down until the recent uptick in October, and still stand below the 2.8%-3%.
What is more interesting is that QE has been disinflationary as money velocity has collapsed and capacity utilization remains poor, at 75%. The massive creation of money has gone to create huge inflation in financial assets and disinflation in the real economy, laying the grounds for one of the most dramatic imbalances between asset classes and industry and consumption seen since the 70s.
The argument against all this is that “it would have been worse” and that the crisis was too big. None of them work, and sound more like excuses as other presidents lived through deep crises as well. But those excuses don´t stack up against the fact that the US created more than half of all the money supply in its history in the past eight years and has seen the longest period with ultra-low rates.
In summary, the Federal Reserve´s policy has generated results that range from disappointing -liquidity- to complete failure -jobs, growth and inflation- but leaves behind a massive bubble in financial assets that will not be easily sorted. Raising rates so slowly only perpetuates the bubble.
No wonder Americans have decided to vote for Trump´s promised supply side policies.
Daniel Lacalle is a PhD in Economics and author of Life In The Financial Markets and The Energy World Is Flat (Wiley)

Daniel,
Great article!
In my area, we have seen a huge flood of capital in form of Private Equity, VC and also buy-out debt (the latter dried up dramatically early 2016). The effect was another bubble, inflating startup valuations and (even more) anything that was acquirable by PE.
I always believed that that capital flood was mainly coming from Asia and maybe oil countries, but based on your article, it seems this is pretty much entirely US money!? Correct?
Do you have any data to put those trillions that were created by QE into perspective with capital from other parts of the world (e.g. China)?
Thanks again, F
If you think about it, most of thet money, even coming from Asia and oil countries, was due to the $2 trillion of inflows of US$ into commodity producers and $1 trillion from China leverage.
Thanks a lot
Also, you speak of $ 24.7 trillion fiscal and monetary stimulus, and further up of 4.7 trillion and 10 trillion debt. How do these numbers reconcile? And over what time was the money released into the system? Thanks for explaining!
US Stimulus 2008-2016
Fannie/Freddie:$7T
Federal deficits:$10T
State/Local deficits:$3T
QE: $4.7T
Total $24.7T