This post should be called “Five Charts And A Warning“.
- Manufacturing PMI fell to the lowest level since December.
Economic Sentiment Indicator (ESI), fell in August from 111.6 to 110.9, the ninth consecutive monthly fall.
2. Capacity utilization weakened as well in the latest data.

3. Industrial Production weakened. Industrial production fell 0.8% vs -0.5% expected. Annual growth rate fell from 2.3% in June to minus 0.1% in July.
Industrial orders fell 1.3% in June.

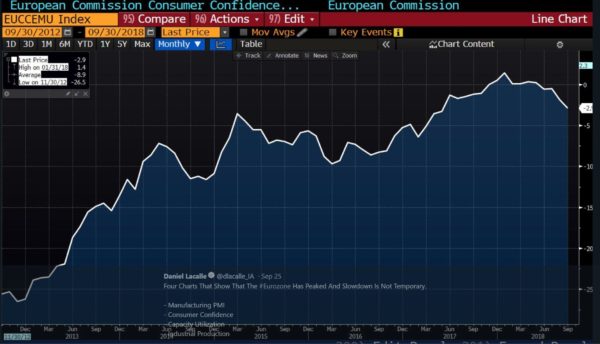
4. Eurozone consumer confidence fell from -1.9 to -2.9.
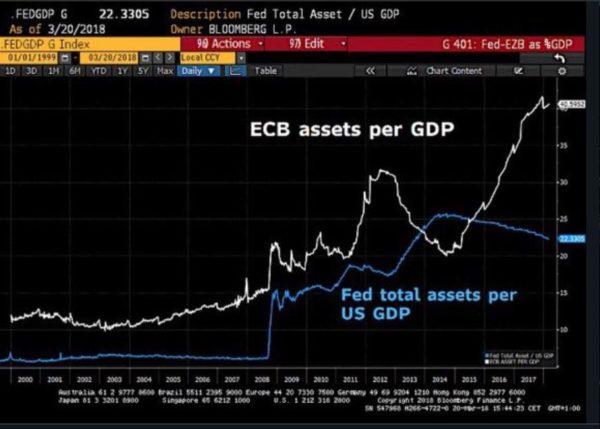
…Only after a 2 trillion euro stimulus and the ECB balance sheet at 41% of GDP.
- Growth trimmed to 2%, down from 2.1% for 2018. For 2019, the forecast is at 1.8%, down from 1.9%.
- Unemployment remains at 8.2%
- Government spending 45% of GDP.
- Debt to GDP 88%.
Warning: THIS is what happens when countries abandon all reforms and bet everything on monetary policy. They sow the seeds of a recession and the central bank runs out of traditional tools.