This is a guest contribution by Seth Levine, CFA.
Many have commented on the froth that they see across the investment markets. To be sure, I’ve contributed my share to this growing collection (see here, here, here, and here for a few). Finding value in the “Everything Bubble” –to borrow a phrase from Jesse Felder–has been undoubtedly difficult. Many have sought the shelter of sovereign bonds. However, this might be misguided, particular as the landscape shifts. I believe that “rates” might be one of the more risky investment propositions available, at least relative to their histories. While this might sound counterintuitive, the potential for losses has rarely been higher in the modern record of the U.S. bond market. It also presents opportunities.
")
Source: Federal Reserve Bank of St. Louis, The Integrating Investor estimates
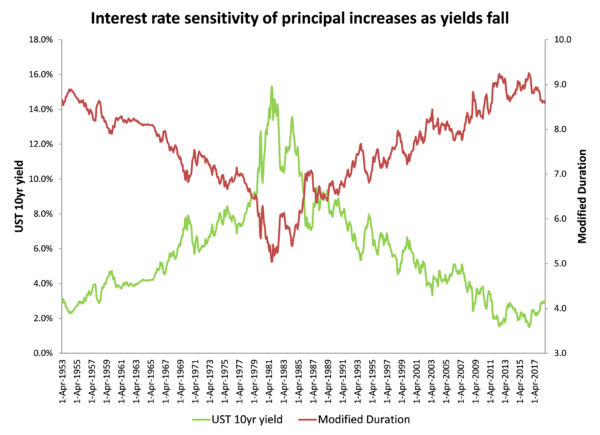
The chart above is my attempt to shed some light on the risks brewing in the U.S. Treasury (UST) bond market. It illustrates the sensitivity of a 10 year UST bond’s price to a 100 basis point move in interest rates, expressed as a multiple of its annual yield. For those familiar with fixed income terminology, it’s simply the modified duration (aka duration risk) divided by the yield. Thus, it contextualizes the amount of interest rate (or inflation) risk one is incurring to annual coupon payments received. While most accept that duration risk comes with the territory of bond investing, it’s not easy to wrap one’s head around it. This metric–which I not-so-creatively call “coupons per duration” (CPD for short)–is my attempt to relate risk to one’s expected return. Think of it as a kind of CAPE ratio for USTs.
The analysis shows that the potential for principal loss remains near the highest levels experienced in the post-World War II era. This will not come as a surprise to even the most novice of bond aficionados. After all, when interest rates rise bond prices fall, and vice versa. Given the secular decline in yields, we would expect such a finding. However, after a couple of decades spent in a downtrend, it’s easy to lose one’s perspective (the “boiling frog” effect). I find the CPD perspective helpful. It reframes the risk of an interest rate and/or inflation regime change into tangible terms.
Investors are currently exposing approximately 3 years’ worth of coupon payments to a 100 basis point rise in rates–nearly a third of one’s expected return. That is some significant potential volatility, especially for a so-called “risk-free” asset. While this exposure has thankfully been halved since the 2016 highs (a result of the painful sell-off), it’s still quite elevated relative to both history and, especially, the memory of most active traders.
Let’s put aside the likelihood for interest rate moves for a moment and drill down into the analysis. As mentioned, modified duration is a measure of a bond’s price sensitivity to a 100 basis point move in interest rates. It is a derivation of a present value calculation that hinges upon the size of the coupon payments, the price of the bond, and its term (i.e. time until maturity). A bond will score higher (i.e. have a greater sensitivity) when its coupon is low, its price is high, and its term long. Thus, duration risk rises as yields fall.
I constructed my CPD metric using the yield of the 10 year UST constant maturity index. I assumed each data point to represent a new “on the run” 10 year bond issued at par. Thus, the data are merely estimates and do not reflect the characteristics of any actual bonds. Still, the exercise is illustrative.
Now, you might be thinking, “come on, what’s the likelihood of a 100 basis point move in interest rates? Implied volatility is low so a move of that magnitude would be quite the statistical outlier.” That is a fair point of criticism. Remember, we are just measuring sensitivities here, not making predictions. That said, 10 year UST rates have risen by a greater amount since the 2016 lows. Furthermore, there is nothing abnormal about a 4.5% yielding 10 year UST bond; there is plenty of historical precedences. And with respect to volatility, it is precisely the mix of high price sensitivity and low expectations for such an occurrence that makes for such a dangerous cocktail (more on implied volatility in a moment).
You might also be thinking, “eh, no big deal, I’m holding my bonds to maturity so I’m not concerned with mark-to-market losses.” That may be true, but there’s another pernicious element lurking in the shadows: inflation. When I use the term “inflation”, I invoke the original usage, as a measure of purchasing power; not the Consumer Price Index or some other muddled construct that might also contain some loose connection to economic growth. Inflation in this sense is a determinant of the money supply (relative to demand). In a fiat monetary system, the control of inflation lies predominantly in the hands of the monetary authorities: the central banks. Thus, investing in USTs is in part a vote of confidence in the ability of these officials to get it the money supply “right.” The lower the UST yield, the less cushion one has against a policy error. Thus, even if your par value remains steady over the term of your investment, your purchasing power might not have; the real yield might have been negative.
Over the past thirty-plus years, yields in the UST market continuously fell creating an associated rise in duration. Since rates were declining, bondholders enjoyed a long-running bull market. While periods of drawdown did occur, they proved to be cyclical in nature. So long as profits compounded, the mounting risks likely went unnoticed (if not outright welcomed given the favorable trend).
Source: Federal Reserve Bank of St. Louis, The Integrating Investor estimates
The continuous decline in yields has not only ground (nominal) returns down to historically low levels, but has also reduced investors’ ability to absorb any losses stemming from a change in interest rates or inflation expectations. At least in earlier times one could rely on more substantial coupon payments to offset any realized or mark-to-market losses; not so much today. In fact, this likely explains why USTs are experiencing the longest losing period in recent history (illustrated below).
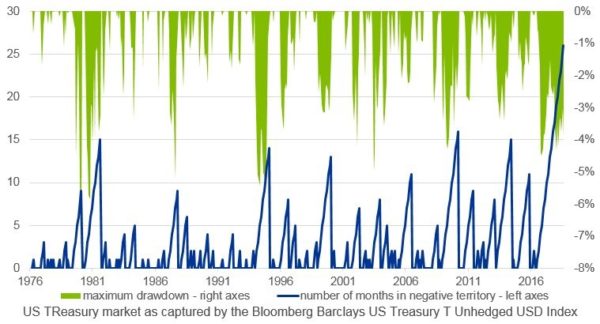
Caption: “Treasuries have experienced the longest losing streak (on a total-return basis) since 1976 (perhaps even earlier).”
Source: @ldaalder, The Daily Shot
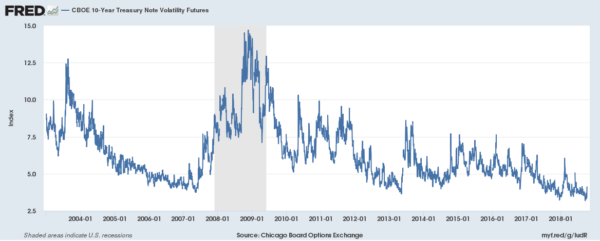
I find it interesting that these drawdowns have occurred while implied volatility marched lower. To me, this only raises the stakes of investing in the UST market. Remember, implied volatility merely depicts investors’ expectations for the future – it is no crystal ball. Because implied volatilities reveal how market participants are positioned it can be, in my view, a useful sentiment indicator. From this perspective, there seems to be little dissent among UST investors; price movements should remain muted. But what if they’re wrong?
We appear to be at a crossroad in the UST market. To be sure, it’s anyone’s guess as to the future direction of interest rates. I am sympathetic to both sides of the argument. On one hand, I understand the bull case that higher debt loads, unfavorable demographics, and a turn in the credit cycle could drive rates lower. On the other, I firmly believe that Quantitative Tightening policies, greater government deficits, and the potential for debt monetization-related inflation could force UST rates higher; possibly in a self-reinforcing manner, as nothing changes investors’ minds like losses.
Regardless of where you shake out in this debate, the risk of error has rarely been higher. Much principal is being staked to small moves in interest rates (or inflation). Central bankers have little margin for policy error. Investor sentiment appears quite uniform in its positioning against the possibility for large moves or errors occurring. Is this cause for panic? Of course not. Hopefully reframing rates-related investment decisions into this risk management construct can bring some clarify to the process and help us better navigate the landscape. Rarely has the potential opportunity set been so large for both profit and loss. Good luck!
Seth Levine, CFA is a professional, institutional high yield bond investor. He is also the creator of The Integrating Investor where he blogs about macroeconomic and investment strategy related themes. You can learn more about Seth at www.integratinginvestor.com and follow him on Twitter at @SethLevine2.
Nice and crisp information.