This article was written by Manuel Llamas and Domingo Soriano published by Libre Mercado here. All copyright Libertad Digital and Libre Mercado. (Wednesday 23rd June 2012).
“A lie repeated a thousand times becomes the truth”. This well-known sentence, attributed to the master of Nazi propaganda, Joseph Goebbels, could also serve to illustrate the great deception of the alleged public austerity in Europe. Since the outbreak of the debt crisis, it is widely repeated that Germany has sought to impose on the rest of the EU partners an adjustment plan focused on cutting costs and implementing structural reforms that would foster economic growth.
This strategy has been harshly criticized by many economists and by the Southern European countries, the weakest in this crisis, with Greece leading the critics. In fact, analysts, politicians and union leaders blame all the current problems of Europe, including the Greek default, on the imposed austerity measures. After the recent French and Greek elections, the critics of Merkel’s strategy have begun to gain notoriety, to the extent that the European summit to be held on Wednesday will focus more on how to boost growth through government spending (stimulus) than on further cuts in policy to reduce the deficit and debt burden.
However, official data (Eurostat) shows that the much-touted European austerity is today little more than a myth. The Greek default was not due to the demanded cuts but due to the decision to keep a bloated state unchanged. Likewise, the evolution of spending, deficits and public debt in the euro area shows that the austerity only exists on paper. Neither governments have stopped spending well above their means, nor have they undertaken structural reforms to enable their economies to improve their productivity and grow solidly in the near future.
More public spending
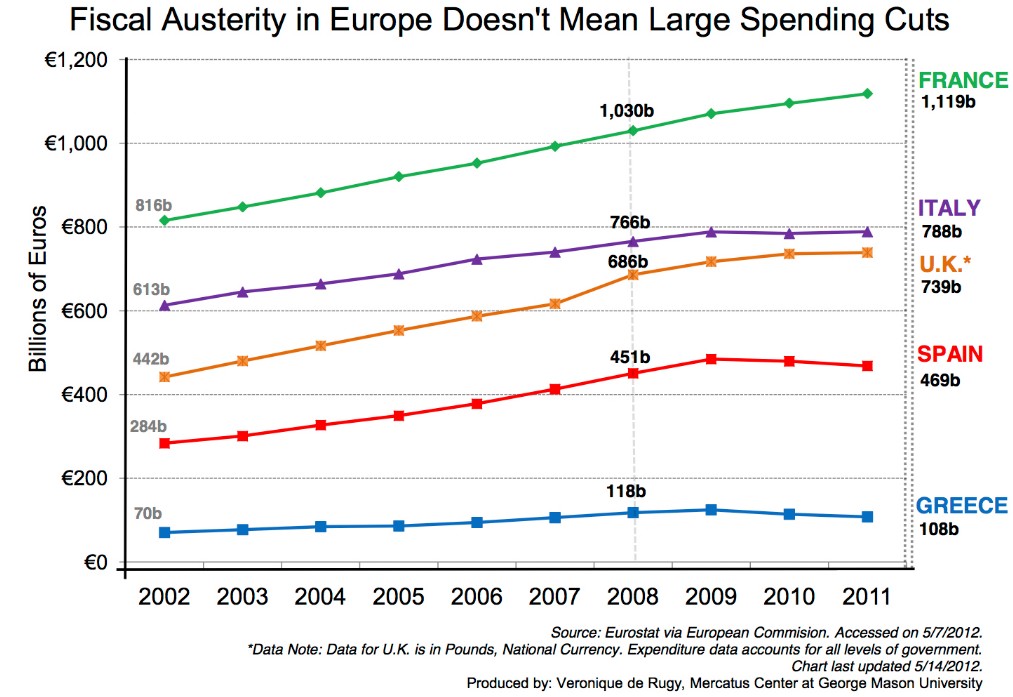
The most striking figure, amid all the rhetoric against the cuts, is that public spending in the euro area as a whole has grown by almost 7% between 2008 and 2011, reaching 4.65 billion euro.
In the South of Europe, those most affected by austerity in theory, the evolution is similar: Public spending in France rose by 8.6% since 2008, in Spain, 4%, in Italy, 3%, in Portugal, 7.8%, while in Greece, despite all the announced cuts, spending fell just 8.5% over the 2008 level, although today its public sector continues to spend 2% more than in 2007 (just before the crisis).
In essence, no European country has managed to reduce their public spending to 2004 levels, a few years before the start of the international crisis, which itself could be considered as an exercise in austerity. Not at all. The following chart summarizes the evolution of public spending in these countries, measured in nominal terms at current prices.
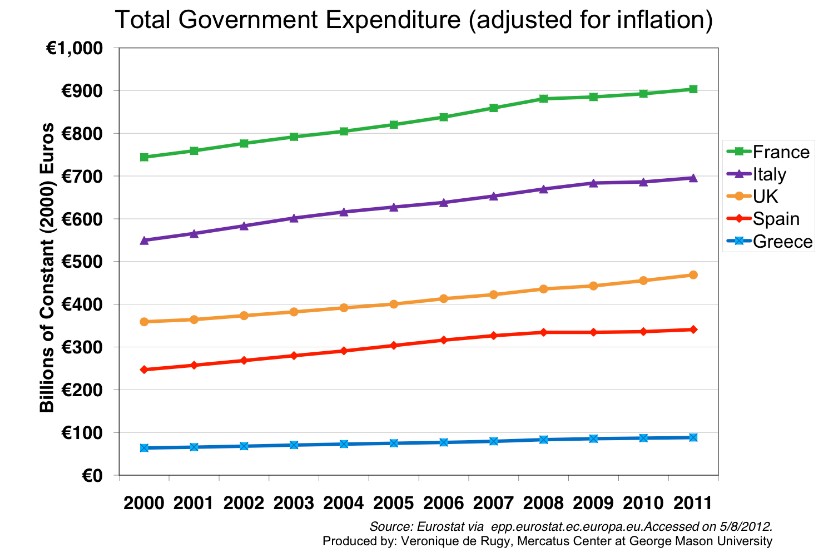 In fact, the situation hardly changed if we look at the evolution of public spending in real terms after inflation.
More deficit and debt
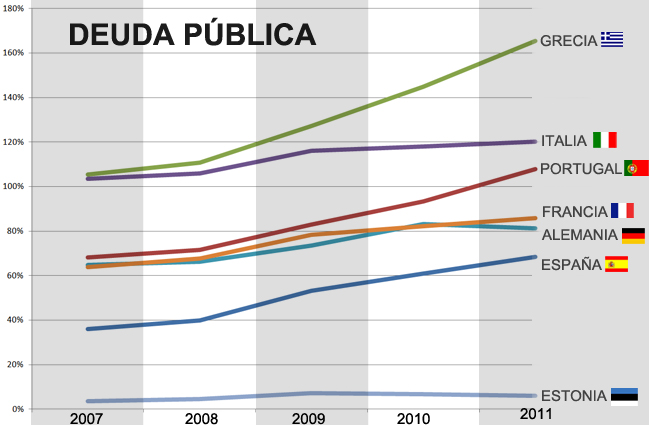
Of course, increasing public spending also meant higher deficit and public debt. As such, in the middle of alleged austerity, the deficit in the euro area as a whole, far from diminishing, has tripled since 2008 , from 2.1% of GDP to 6.2% in 2011, while public debt has grown from 70.1% in 2008 to 87.2% of GDP last year.
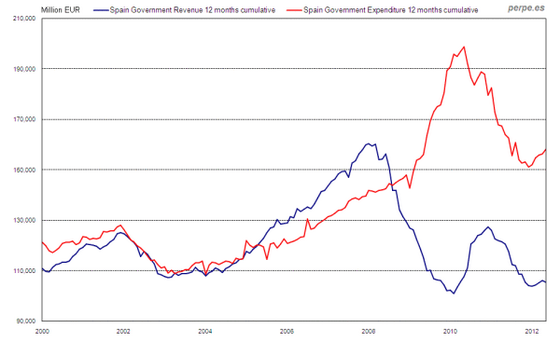
As we can see in the graph below, the public sectors in Spain, Greece, Italy and Portugal, the four southern European countries most affected by the debt crisis, are still spending more than they earn. Only a few countries in the North and East of the continent (exemplified here by Germany and Estonia) have maintained their public at deficit under control during these years of crisis.
Chart above shows public deficit.
The current crisis began in 2007. From then until late 2011, the four southern European countries we are considering implemented aggressive public “investment” policies that Keynesian economists would qualify as clearly expansionary, with deficits close to or above 10% for several years. If this theory were true, Greece, Portugal and Spain would have already recovered and the growth generated by the “virtuous circle” created by government spending would be paying their debts. But none of this happened.
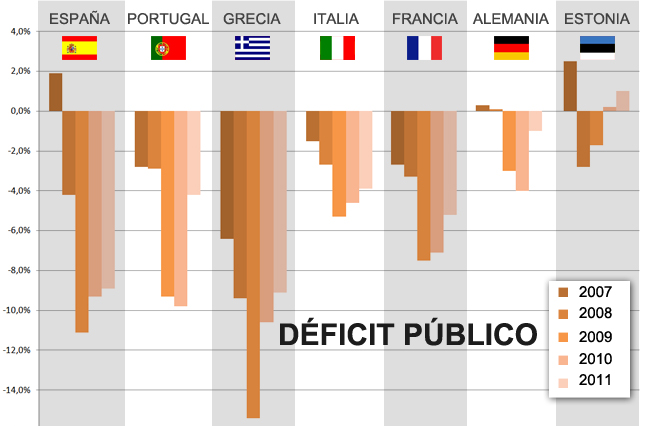
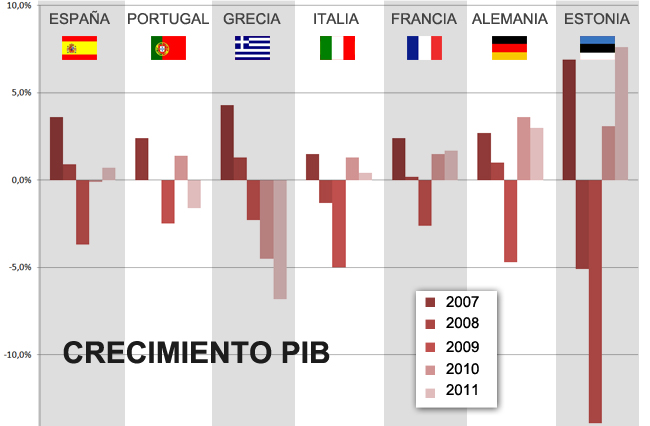
Meanwhile, Germany and Estonia followed the opposite path and imposed austerity. The result is that both countries had a strong relapse in 2009, with the political cost that it entails . But they are recovering faster and now have much stronger economies. Meanwhile, in Spain, the “Plan E” of investment in infrastructures, an enormous waste of public funds with its vast implication on cost of borrow and deficit, and other public spending measures have failed to stem the crisis. But the message currently repeated over and over is that it takes even more government spending, for much longer, to foster growth. But… For how long?
Chart above shows growth in GDP
Follow Manuel Llamas on @manuel_llamas