As usual, lowly utilities are ignored, all we read about is the oil price issue. The real news is the savings coming to US consumers on power and gas bills. Assuming the average household pays about $100-$150/month for power and $85/month for natural gas. In the future, those bills should fall to $70-$120/month for power, saving perhaps $30-$40/month, or $375-$450/yr; and $45/month for gas, saving another $400/yr, for a total of about $700-$900/year.This is before the weak weather effect too, which will have lead to much lower usage levels than expected during 2012.
Compared to a $0.50/gallon rise in gasoline, on 500 gallons/yr (15,000 miles at 30mpg), that equates to $250/yr. In other words, gasoline could move from $3.00/gallon to $5.00/gallon with no net impact at home. RBOB gasoline contracts are at about $3.32 today, up $0.80 since early 2010. Maybe not a big deal in comparison; and for further comparison, the Bush income tax rebate checks (remember those?) were about the same ‘net’ amount, $400/household/yr.
Importantly, the bills for gas/power are delayed–hedges roll off, rate plans adjust slowly, etc, but it all comes through eventually.
The impact to businesses and industrials in the US, you can imagine, will be large and accretive to earnings.
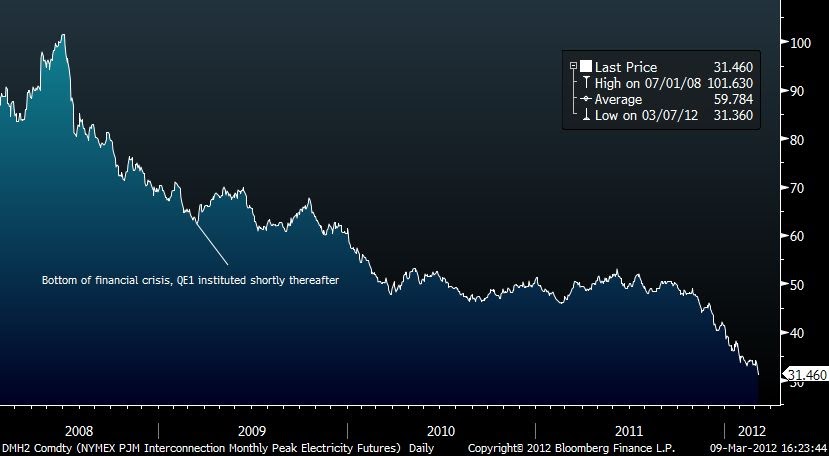
US-PJM Monthly Peak electricity price futures.
Also of importance: in a power or gas utility bill, roughly 50-60% of the total bill will be fixed cost charges–largely invested capital and its cost–and thus not be impacted by a decline in power/gas prices, that is embedded in our calculation on total savings.
While it is true that some states won’t see as dramatic a decline as others and the timing will be constrained by rate mechanisms, as well as the timing of puchased power contracts/hedges rolling off, it would be incorrect to assume that these declines won’t flow through customers bills, eventually they will. In some states, power charges are disaggregated and run on a trailing moving average that simply run through bills.
While its true that the % of gas used to generate electricity is around 25%, the price of natural gas sets the price of electricity in many if not most of the major US power markets during peak hours, and during most of the year (exceptions being soft shoulders in April and October), due to marginal cost dispatch economics. This is particularly true for California, Texas and Florida, three enormous markets.
Now, a fully regulated utility is likely to use ‘average cost ratemaking’, in which case the moderations of natural gas price will be less impactful than in those markets with competitive structure (like PJM). Nevertheless, you would still expect to see 5-10% declines in a total bill in those regions. Where gas is on the pricing margin–some of the larger markets–you expect larger and faster declines in customer bills, as soon as this year in fact.
We are getting some odd reads on the US economy at the moment, which have obviously made their way into the bond, equity and gold markets now. In the past few days, there appears to be a rapidly accelerating acceptance of a better economic tightener, confirmed by the Fed yesterday, albeit begrudngingly.Goldman went so far as to outright recommend shorting/selling 10-yr Treasuries this morning (which the market did!). That is relevant inasmuch as they have been the leading cheerleaders for QE and much lower growth and rates, throughout the post 2008 period, well below consensus. Ironically, Morgan Stanley has been the leading proponent of inflation and faster recovery since QE1, and obviously got that very wrong…and yet this morning, they are out pounding the table that from their perch, most of the blast is inventory re-stocking and they see Q1 coming in at a very-low 1.3-1.5% GDP growth, below consensus
I’d love to say MS is getting it wrong both times (post 2008), but there are two factors out there that are puzzling….
According to analysis on power demand data in the US over the past 4-5 months, adjusting for the unusually low weather, power demand is growing at .6% per annum, and using historic correlations between power demand and GDP, GDP is growing at 1.3% now Y/Y. Prior period was 3.0%, though JP Morgan is out saying today that there will be a .5% revision upward to that number due to medical care spending up 15% vs 2.6% expected. (source: Macquarie, and others). The argument here is that efficiency, while slowly building in, can’t explain all the decline in demand and something else is happening.
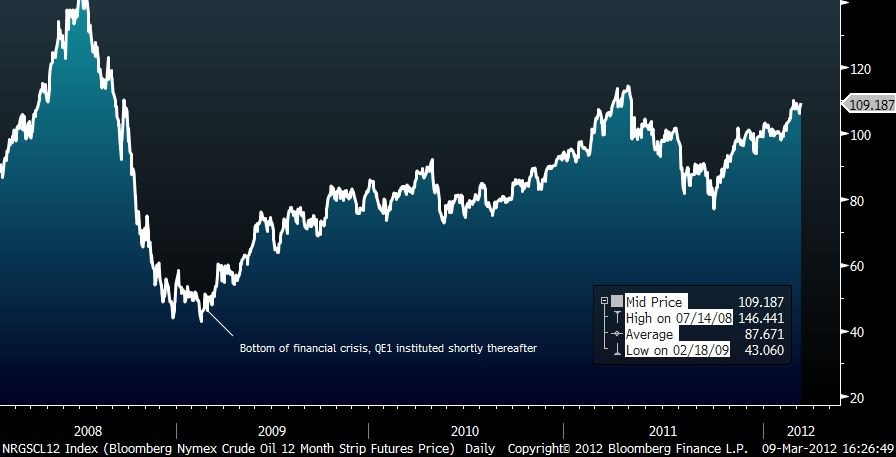
Using DOE Crude Oil output implied demand statistics, the US just seems to stay virtually flat now for several years now–despite rising population and decent GDP growth. Certainly some of this is low moving rates for homes and efficiency in auto mileage, but that also alone seemingly might not explain it all.
Maybe things are different this cycle–internet efficiencies, power demand efficiencies in devices and appliances, etc. But it bears watching, because these are big data sets that never used to ‘lie’. Its possible the gas/coal switching is reducing oil demand enough to show up a smidge? As an aside, Macquarie calculates that based on real-time power generation data they are seeing in the US, as much as 100GW of coal is currently idled–that is 1/.3 of the entire fleet. Some is coming back online through forced burn due to dangerous stockpile levels (high) and maxing out their low point on annual allocations from the producers. Yikes.
Further read:
http://energyandmoney.blogspot.com/2010/10/has-cheap-gas-killed-renewable-star.html#
http://energyandmoney.blogspot.com/2010/12/can-oil-and-nat-gas-go-back-to.html#
http://energyandmoney.blogspot.com/2010/10/us-natural-gas-picture-gets-bleaker.html#
Children these days have many more electric toys and games and devices than we did when we were their age. That’s why it’s crucial everyone members be engaged in any strategy towards decreasing power expenses.
http://www.rentalprotectionagency.com.
I recently came across your blog and have been reading along. Yes it is interesting and attractive. I like it. I would to share this: inventhistory
Clothing
Communication
Entertainment
Electric
Financial
Food Preparation
Green Technology
Software
Warfare
Transportation
Instruments
Office
Dan beecroft says for drilling, Oklahoma is the most precious place. She is well known for her historical oil and gas reserve This state has shown a hard time in oil production but things have changed and Oklahoma is moving on and now it is 5th greatest producer of crude oil, and has the 2nd-largest number of active drilling rigs.