Category Archives: Energy

Energy

Before we start worrying about US Oil demand again… Non-OECD is the key

DOE data trading is starting to be both irrelevant and more importantly, dangerous. We are seeing oil price swings on a weekly basis worried about US demand. That should not be the focus. US demand peaked, according to Rex Tillerson in 2005 and OECD demand in 2006. This is also very logical given that oil production from OECD countries has been declining since 1997 and is now way below 23% of the world production. Therefore, it is normal that OECD demand tops out and declines as we see the effects of efficiency, maturity, saturation of the credit bubble model and Obama’s beloved electric car (the one we will all be forced to buy at $60k a piece).

Meanwhile, Non-OECD consumption grew from 40% of the world demand in 2004 to 45% in 2009. No wonder we are seeing reduced exports to the US.

How low can the OECD consumption go? At the moment, demand for the OECD excluding the US is around 12 barrels per capita per year (US is 25 barrels per capita per year). The IEA is predicting by 2015 a further consumption decrease toward 10 barrels/capita/year for the OECD excluding the US and toward 20 b/c/year for the US.

The key thing is that (unlike what we believe in US-EU financial markets), non-OECD countries are much less price sensitive than OECD ones, as their growth requirements and modernisation are much more “essential” and energy intensive, so the swings to price from demand drops depends on OECD. Therefore, oil prices will have to be high but not too high to keep the demand growth steady. Right now everyone, including the figures I saw recently, assume an impact of $20 per 1 mbpd of excess demand (and similar on the way down), from a “sustainable” $65/bbl break-even.

The elephant in the room: Producing countries demand growth. Many expect something close to an “export extinction” with a decline in exports (below the 2006 level) of between -33-46% by 2011.

The second elephant in the room: Energy intensity of “infrastructure plans to move away from evil foreign oil”. According to Chevron, the stimulus packages and infrastructure plans are adding 2mmbpd of oil demand while supplyis slipping 5%. Hard to argue when, in Spain, the example of renewable overbuild, with demand down 7% and renewables blowing out all technologies, oil imports have not fallen significantly (1.2mmbpd).

The third elephant in the room: Oil investments peaked in 2008. All energy agencies estimate that capex required to maintain production is slipping. Below $220bn a year, decline (currently at 5%) accelerates.

The fourth elephant in the room: non-OPEC growth is overestimated. See today Lukoil.Interfax reports Lukoil’s strategic development plan for 2010-2019 with a drastic slash on previous 10-year growth targets (only 0.3% average growth versus previous of 2.2%). Wait for Rosneft to do the same.
Bye bye Yen?

Just a thought, only marginally out of the energy sector, but given the surprise change of government in Japan, and what appears to be a growing sense in the market that this government is more focused, finally, on fiscal restraint (or least this threat of massive debt overhang to deal with) and less concerned about maintaining the weak-policy on JPY and even stating their ability to intermediate has declined, it looks like the JPY is keeping its bid. The market—big vocal guys like Jim O’Neil at GS for example—have been pounding the table that the JPY would decline back to 120 eventually on failing demographics and a larger global recovery, and it’s on its way, but slower. Maybe it’s because the US has usurped Japan as the ultimate source of funding and itself is now in a fiscal death spiral; maybe it’s these demographics and the start of deleveraging a bit, I’m not sure, it’s complicated. But whatever the root cause(s), the implication of a stronger than expected JPY (particularly against the $) absolutely HAS to be a weaker domestic industrial and manufacturing economy in Japan. Until China de-pegs, Japan’s opportunities for exports (at least market share risk) seem to be declining; in fact, what we are seeing are Japanese companies setting up shop in China (or elsewhere) instead, similar to the US. Therefore, the Japanese ‘equity market’ might be able to do ok, particularly if this increased JPY leads to a bit of insulation on domestic consumption, but the Japanese economy could be fairly troubled. Utilities would be in the cross hairs of declining consumption.

The key to figure out is: is this a currency issue primarily, or is it something else structural? We know that Japanese energy companies are short Yen in revenues and long Yen in expenses, eg, their costs fall when the JPY is strong, but now perhaps the JPY relative strength is enough to have structurally interrupted volumes and we know what slack does to prices on top of that!…

Weekly commodity outlook

Oil continues to drive the commodity complex.Why is oil more buoyant than other commodities?Probably more to do with funds flows and consistently positive macro-economic datapoints (up to the end of week US unemployment data) rather than any specifics relating to the oil market.Could this change near-term: we think not.Next week will see the three main forecasting agencies publish monthly updates; their demand estimates have started to move up (and look to have further to go) but more importantly supply estimates still look too optimistic.

Why is gas not following oil?In the US, the weight of evidence that is pointing to improved productivity means that the US will be self-sufficient even allowing for a reasonable demand recovery in 2010.Outside the US, gas’ recent weakness relates more to higher Qatari and Nigerian LNG exports (maybe 1.5bcf/d), but this is still small in relation to the issue of Gazprom releasing the gas buyers from pipeline deliveries (potentially 6bcf/d).So need to watch those Gazprom negotiations, but we’d stay positive on gas outside the US.

Why is coal no longer following oil?Much of the positive demand trends (eg South Korea) and supply restrictions (Australia and Colombia) remain.However, for once there was a big pick-up in South African exports.Newsflow is scant but we suspect that this could signal the expanded port capacity is becoming operational; which if confirmed could see coal prices give up their sharp contango.

In short, retain a bull view on energy, but recognize that this is becoming confined to oil and gas outside the US.And the risk of higher coal supply out of South Africa, if confirmed, could push us to a bearish stance on thermal coal.

ECONOMIC BACKDROP:

Bull news:

  • Chinese October PMI rises to 55.2 v 54.3 prior, and the State Council Research Centre predicts 9.5% Q4 GDP growth
  • US October ISM rises to 55.7 v 52.9 prior, while Sept factory orders up 0.9% mom versus -0.8% in August.
  • UK Sept Industrial Production up 1.2% mom.
  • Bear news:
  • US October unemployment rate hits 10.2% against an expectation of a rise to 9.9% from September’s 9.8%.

OIL OUTLOOK: POSITIVE

Bull news:

  • Chinese apparent crude oil demand lifted to 3.3% in H1 after declining 1% in H1. Car sales up 76% YoY.
  • Yemeni based terrorist activity aimed at Saudi Arabia is increasing, although yet to get much media attention.

Bear news:

  • OPEC October output rises, although concentrated in Nigeria.Shell indictes it still has 0.8mbpd shut-in in Nigeria (the lull in rebel activity is unlikely to be permanent but should last beyond the turn of the year).
  • Russian oil output tops 10mbpd in October.

GAS OUTLOOK: NEUTRAL

Bulls on US gas are receding rapidly with the weight of evidence about the resilience of US domestic gas production.Bearish gas pricing could spread outside the US but only if Gazprom forces its pipeline gas into Europe, as then surplus LNG would push UK pricing closer to Henry Hub.Gazprom will allow gas buyers to lift less than contract commitments.

US depressed by domestic supply, Europe heading for balance thanks to Gazprom

Bull news:

  • Russian Sakhalin LNG is taking one of its two trains down till the year end, taking 0.6bcf/d.
  • Ukraine negotiating a postponement in its payment for October gas (from 7th November to 20th November) doesn’t bode well for Gazprom’s ability to push its volumes into Europe, although October itself saw European exports up 3.1bcf/d (19%) mom.

Bear news:

  • US official August gas production data showed a 0.5bcf/d increase mom even though this is more than six months after the gas rig rate was in freefall (it declined by over one-third from its September 2008 peak by the end of February 2009).Moreover, Chesapeake’s Q3 beat estimates in part thanks to lower costs.
  • Qataris reveal that all three of its new megatrains are at full capacity (totaling 3.2bcfpd and adding 1.5-2.0bcf/d over expectations).

COAL OUTLOOK: Neutral

Bull news:

  • Monthly Australian thermal coal exports drop to 10.7mt in September, the lowest since April, as met coal crowds out limited export routes.Exports through Newcastle port though have moved up to 102mt annualised but the assumption must be that this growth continues to be driven by met coal.
  • Data from Colombia confirms exports down 4.2mt ytd despite commissioning of new mines.
  • South Korean generators take 6.6mt of coal in September, up 19% yoy.

Bear news:

  • South African exports jump to 81mt annualized rate in October.Over the summer exports have been way below expectations since the port’s expansion from 72mt annual capacity to 92mt annual capacity was supposed to have been ready in July.This may signal the expanded facilities are now operational.
  • Indian inventories continue to build while buyers said to be out of market for 2009 deliveries…

What do you buy into market weakness? Big Oil… Big Cash

bp vs ftsee

The market has been using Big Oil and utilities (specially large caps) as sources of funds for their beta trades, especially financials and miners. I hear that short interest in BP is 12% of free float, for example.

As the mood in the market turns bearish and the concerns on balance sheets return to a market that forgot what net debt was, the focus, like in the past November, turns to real cash monsters.

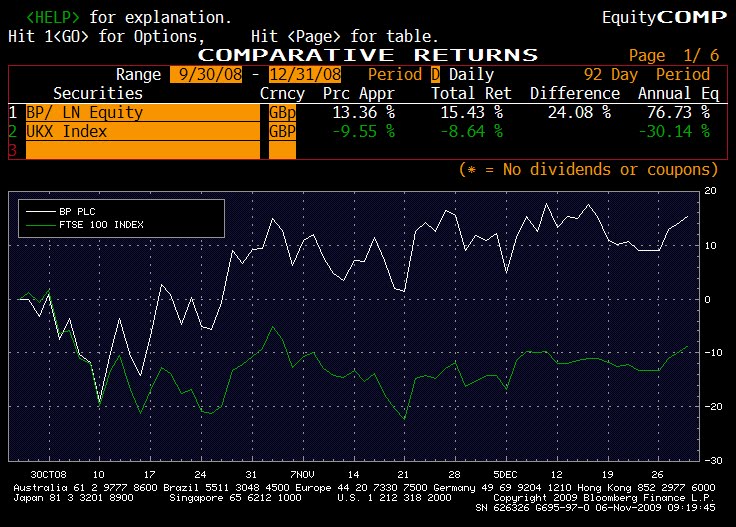
If we add to this that most of the market went short Big Oil after the 3Q results showed that growth was not appearing, and especially after lacklustre earnings from RDS and Total, we have a perfect storm. Last November, with oil going from $70 to $50 and the market disappearing downhill Big Oil outperformed the market by 12% into December.

Big Oil trades at 10x PE, 0.6x to the broad market (almost 15% from historical levels), generated 15% free cash flow yield last quarter (!!), delivers dividend yields that range from 6 to 7% and more importantly, has virtually no debt (Statoil 26% ND/Equity, BP 23%).

Into Megacap utilities, these have underperformed but now, ahead of 3Q in E.On and GSZ, the focus will turn back to free cash flow generation and balance sheet. Here the issue is that Enel, Iberdrola are massively debt constrained so the market opportunity is not as wide as in Big Oil (as utilities balance sheets are quite different, unlike in supermajors), so we are likely to see a move to real defensives, ie regulateds and megacaps.

The chart shows what BP did against the FTSE from Sept 08 to Dec 08 with oil falling and the market down.