Category Archives: Energy

Energy

Oil prices below OPEC budget needs

brent august 2014


Oil prices are today below most OPEC producers’ budget needs

Oil prices needed to meet expenditure
($/bbl)
OPEC Country 2012 – 2013
Algeria 121 – 119
Angola 81 – 94
Ecuador 112 – 122
Iran 123 – 136
Iraq 100 – 116
Kuwait 61 – 59
Libya 94 – 111
Nigeria 118 – 124
Qatar 59 – 58
Saudi Arabia 87 – 92
UAE 82 – 90
Venezuela 102 – 117

Brent is down at $102.55/bbl driven by Libya has making progress in increasing production, rising to 535k b/d on increased output at the El Feel & El Shahara fields. On the geopolitical side, there are reports Kurdish forces, backed by US airstrikes, have reclaimed territory around the Mosul dam from Islamic State fighters. In Ukraine the situation remains tense with Ukrainian forces apparently reclaiming control of the police station in Luhansk that has been under rebel control for several months.

The shale gas and oil revolution in the US has shifted the geopolitical premium and has also dramatically reduced the anxiety about short term supply or needs to call on Saudi Arabia for incremental supply. The US is now the largest oil producer. U.S. production of crude oil, along with liquids separated from natural gas, surpassed all other countries this year with daily output exceeding 11 million barrels.

This shows how well supplied the market is. Despite Iraq, Ukraine, the Ebola threats to Nigeria production and geopolitical issues globally, demand cover is at five year highs in the middle of a global GDP that continues to grow.

oil disruptions

In the US, at 366mb crude stocks are in the upper half of the average range for the time of year. Gasoline inventories are in middle of the average range. OECD inventories are at the upper level of the average range.

The IEA shows demand growth is under pressure from higher levels of efficiency and modest macroeconomic recovery.  While front-month Brent is in contango the back of the curve is about $10/bbl higher than last August showing this weakness is seasonal. The IEA and EIA both lowered their global oil demand growth forecasts for 2015 by 0.1 mb/d to 1.3 mb/d and 1.4 mb/d, respectively. The IEA also reduced its 2014 demand growth projections by 0.2 mb/d to just 1 mb/d on weak 2Q14 demand growth (0.7 mb/d YoY). The IMF’s recent downgrade of its global GDP forecast by 0.3pp to 3.4% also emphasised weak economic recovery. OPEC expects global demand growth of 1.1 mb/d and 1.2 mb/d in 2014 and 2015, respectively.

In ‘The Energy World Is Flat’ (Daniel Lacalle & Diego Parrilla, Wiley 2014), our forthcoming book, we highlight the end of peak oil from the combination of efficiency and ample supply. IEA’s World Energy Outlook shows that by 2035, the world can achieve energy savings equivalent to nearly a fifth of current global demand.

Yellen & Co. are literally grasping at straws to explain the ‘phenomena’ associated with (now) normalized employment and capacity slack/low inflation.

She might want to get out and visit some of the efficiency engines across the country, starting with online commerce. Silicon Valley/SF looks, smells and tastes what you would expect (bouyant labour and wage growth and sharper inflation), at the expense of much of rest of country.

Thisn has been regularly happening over the last 300 years. Productivity/technology led disinflation can be incredibly powerful.

Coming to your industry via substitution real soon.


Important Disclaimer: All of Daniel Lacalle’s views expressed in this blog are strictly personal and should not be taken as buy or sell recommendations.

Russia may remain cheap for a while

The geopolitical landscape created by the Ukraine crisis and the ongoing sanctions against Russian interests from both the EU and US have made the MICEX Index fall 4% YTD.

For investors, the main things to consider:

– Russian stocks are cheap and they have always been. Headline multiples disguise a market where the semi-state owned companies tend to pursue a strategy that is less focused on total-shareholder-return than on maximizing capex. State intervention and value destructing investments have been some of the factors behind the de-rating of Russian stocks.

On the flipside, Russian independent companies have been following a very shareholder oriented policy (think Novatek, for example), reacting inmediately to rumours and creating value by being focused. So the index large weights cloud a market where some companies do shine and develop solid strategies.

Therefore, for investors, the key is stock picking, not index buying… and focusing on clear strategy independent companies, not necessarily on the “headline cheap” multi-megacap conglomerates. These are OK for a short term technical trade driven more by oil price momentum and geopolitical risks easing.

– Ruble strength is likely as oil prices remain high, and with low debt and little financial dependence on foreign entities, Russia can sustain the economic slowdown created by sanctions better than the EU debt-ridden countries with strong commercial ties with Russia. The current oil price-ruble combination prevents any risk of economic collapse in Russia and, to a limited extent, the state can substitute for foreign lenders in strategic sectors. However, without a big pick-up in inward investment and domestic confidence, the economy will not be able to move from near stagnation to the sustainable 3-4% annualized growth it needs, according to Chris Weafer. Russia’s balance sheet and budget are solid and the government can afford to provide domestic funding to banks or to raise public investments.

– Besides the human tragedy, the consequences of the MH17 crash may also be less lending from European banks to Russian companies, which could make the Russian economy even more isolated on markets. The direct impact on European credit is likely to be contained however, as exposure to Russia is already limited (with the exception of Austrian banks), according to RBS. But in a worst-case scenario, Europe remains dependent on Russian gas. Today there is no risk as gas inventories are at five year highs (83%) but any cuts to supply could make several countries vulnerable during the winter.

– The US is imposing sanctions with the EU’s pocket. The US has very limited exposure to Russia, while the EU -and countries such as Italy or France in particular- are heavily exposed.


Additional read: Check Chris Weafer, one of the top experts on Russia, from Macro Advisory.


Important Disclaimer: All of Daniel Lacalle’s views expressed in this blog are strictly personal and should not be taken as buy or sell recommendations.

Sitting in a weak energy commodity environment

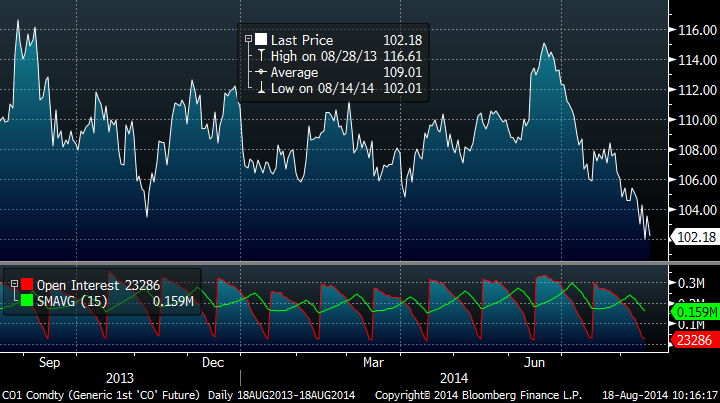
As I predicted, Brent lost all the geopolitical premium of the Iraq crisis to trade at $110.46/bbl as Libya exports rise to new highs offsetting the Iraq concerns, and showing how well supplied the market is. WTI moves to $103.77/bbl driven by increased US production, now at 11.7 mbpd.

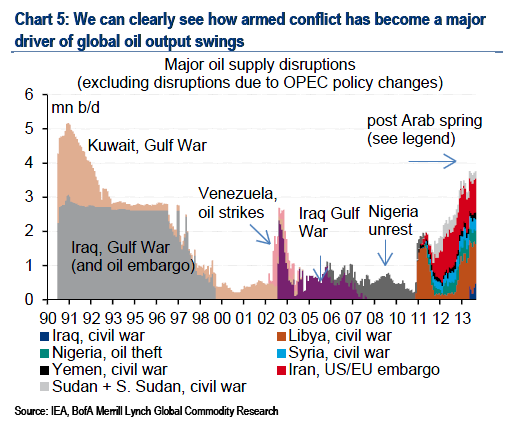
Fighting between the Iraqi army & ISIS continues but with few developments over the weekend – the conflict remains well away from the main Iraqi oilfields in the south of the country. At the same time, Saudi Arabia is believed to have deployed 30,000 troops to its borders with Iraq. Furthermore, Jihadists of the Islamic State took control on Thursday 3 July of the Al Omar oil field in the east of Syria.Libyan production is currently 325,000 b/d.

Libya’s NOC officials said that they were considering lifting the force majeure on the Es Sider and Ras Lanuf terminals, which has been in place since August 2013. The Es Sider terminal holds between 3.5-5.5Mbbls of oil in storage, meaning new production is not needed to resume oil loadings. Es Sider and Ras Lanuf terminals accounts for 50% of Libya’s export capacity (or 500kbpd).

Coal loses ground at $77.70/mt and is below the key support of $78/mt. Highly unlikely to see it strengthen as summer sees more exports from Australia and South Africa.  Coal weakness shows the oversupply in the market, close to 20%.

Chinese thermal coal imports fell sharply in May, down -19% month-on-month seasonally adjusted and -20% y-o-y. The fall has been driven by declining thermal power generation due to broadly flat overall demand and improved hydro and renewables generation.

CO2 at €5.55/mt… The moment that backloading buying is reduced, it collapses…. Down 6% MTD.

US gas at $4.27/mmbtu as milder weather affects slightly the supply-demand balance. However, inventories are at 666 Bcf below last year’s 2,595 Bcf and 790 Bcf below the 5-year average. Still supportive.

The EIA reported an injection of 100 Bcf, matching forecasts of a 100 Bcf. U.S. working gas in storage is now at 1,929 Bcf, 29% below the five-year average of 2,719 Bcf and 26% below last year’s level of 2,595 Bcf. Weather forecasts for the U.S. over the next six to 10 days call for above-average temperatures on the West Coast and East Coast.

UK gas lost all the premium from the Ukraine crisis and more, down at 35.40p/th (-46% YTD) as inventories rise above 4,250mcm and demand weakens…. The contango is at 26p/th.

The EU levels of gas storage are truly high at this point. UK is at 83.28%, Germany at 76.80%, Netherlands at 98.7%, Spain at 94.5%, Italy at 76.80%… Only France remains oddly low at 54.75%.  These high levels of storage explain the weak gas prices despite Ukraine and the lack of concern from countries about security of supply.

Power prices continue to fall in Europe. German power is down at€34.20/mwh (-7.1% YTD), French power at €41.55/mwh (-6.4% YTD) and Nordpool at €31.20/mwh (-2.7% YTD)

Dr. Fatih Birol, IEA’s Chief Economist just gave some of the key conclusions from IEA’s World Energy Investment Outlook which was published last week.

Main conclusions:

1)            Over $22 trillion forecasted oil and gas capex over the next 20 years. Need for investment in Middle East oil production: Dr. Birol expressed concern over the current lack of appetite to invest in new oil and gas projects across the Middle East, despite oil prices at $110/bbl. If oil prices were to fall, the level of investment from both Middle East NOCs and global IOCs would be even lower. Over the next 20 years, the IEA estimates the Middle East will account for almost a third of global new oil production.

2)            LNG prices likely to remain high: There is now more than $700bn invested in LNG infrastructure, but the cost of shipping LNG around the world remains high. Dr. Birol highlighted that the cost of transporting gas via LNG is 10x that of crude. Despite low US gas prices, the additional liquefaction and transportation costs mean gas price differentials between the US and Europe/Asia are likely to persist for some time.

3)            In Europe, wholesale electricity prices are at least 20% too low: Over the next two decades, Europe needs $2.2 trillion to replace ageing electricity infrastructure and meet carbon targets. However, these investments will not happen under current market conditions, according to Dr. Birol. He highlighted that power prices are about 20% too low to recover costs on new investments. Weak power prices are the result of lacklustre demand and heavily subsidised renewables along with cheap coal imports from the US. Dr. Birol pointed out that total investments in European renewables so far have been three times the size of total investment in US shale gas production. With some overcapacity in the European system, there is some breathing space, but 100GW of thermal capacity is needed over the next decade to safeguard reliability.


Important Disclaimer: All of Daniel Lacalle’s views expressed in this blog are strictly personal and should not be taken as buy or sell recommendations.

China Energy Demand Stalls

China oil demand growth disappointed in May, with apparent demand contracting 1% year-on-year.

Consensus estimates +3-4% year-on-year oil demand growth forecast this year, which now needs to average c6% y/y growth from June onwards to be reached.

Natural gas supply growth recovered in May to +15% y-o-y after a disappointing 3% y-o-y growth in April. Imported gas remains c33% of China’s total supply

Thermal coal imports fell sharply in May, down -19% month-on-month seasonally adjusted and -20% y-o-y. The decline has been driven by declining thermal power generation due to broadly flat overall demand and improved hydro and renewables generation.

Fuel oil net imports (graph attached) fell to the second lowest on record for May and kerosene net exports reached a new high for the year. Apparent demand for fuel oil was extremely weak in May, down -32% y-o-y as industrial demand remains weak.

Agricultural imports fell steeply in May, most notably wheat and sugar – each down nearly 40% month-on-month seasonally adjusted. Better rainfall early in the year may lead to improved domestic harvests for a number of crops, reducing appetite for imports later in the year.

In aluminum I still see accelerating capacity addition.

At the higher end of the cost curve, Chalco Guizhou, Zhunyi, Yulong plan to restart 330kt old capacity after the local government granted a RMB12cent/kwh tariff subsidy. Gansu Hualu will restart 50kt old capacity. Baotou aluminum will start 150kt new capacity with captive power plant. Zhongfu has been granted RMB4cent/kwh on the power grid pass-through fee.

At the lower end of the cost curve, Shenhuo will complete the second 400kt capacity in Xinjiang. East Hope, Tianshan and Xinfa will complete 350kt, 500kt and 550kt additional capacity in 2H14.


Important Disclaimer: All of Daniel Lacalle’s views expressed in his books and this blog are strictly personal and should not be taken as buy or sell recommendations.