Category Archives: On the cover

On the cover

Oil prices below OPEC budget needs

brent august 2014


Oil prices are today below most OPEC producers’ budget needs

Oil prices needed to meet expenditure
($/bbl)
OPEC Country 2012 – 2013
Algeria 121 – 119
Angola 81 – 94
Ecuador 112 – 122
Iran 123 – 136
Iraq 100 – 116
Kuwait 61 – 59
Libya 94 – 111
Nigeria 118 – 124
Qatar 59 – 58
Saudi Arabia 87 – 92
UAE 82 – 90
Venezuela 102 – 117

Brent is down at $102.55/bbl driven by Libya has making progress in increasing production, rising to 535k b/d on increased output at the El Feel & El Shahara fields. On the geopolitical side, there are reports Kurdish forces, backed by US airstrikes, have reclaimed territory around the Mosul dam from Islamic State fighters. In Ukraine the situation remains tense with Ukrainian forces apparently reclaiming control of the police station in Luhansk that has been under rebel control for several months.

The shale gas and oil revolution in the US has shifted the geopolitical premium and has also dramatically reduced the anxiety about short term supply or needs to call on Saudi Arabia for incremental supply. The US is now the largest oil producer. U.S. production of crude oil, along with liquids separated from natural gas, surpassed all other countries this year with daily output exceeding 11 million barrels.

This shows how well supplied the market is. Despite Iraq, Ukraine, the Ebola threats to Nigeria production and geopolitical issues globally, demand cover is at five year highs in the middle of a global GDP that continues to grow.

oil disruptions

In the US, at 366mb crude stocks are in the upper half of the average range for the time of year. Gasoline inventories are in middle of the average range. OECD inventories are at the upper level of the average range.

The IEA shows demand growth is under pressure from higher levels of efficiency and modest macroeconomic recovery.  While front-month Brent is in contango the back of the curve is about $10/bbl higher than last August showing this weakness is seasonal. The IEA and EIA both lowered their global oil demand growth forecasts for 2015 by 0.1 mb/d to 1.3 mb/d and 1.4 mb/d, respectively. The IEA also reduced its 2014 demand growth projections by 0.2 mb/d to just 1 mb/d on weak 2Q14 demand growth (0.7 mb/d YoY). The IMF’s recent downgrade of its global GDP forecast by 0.3pp to 3.4% also emphasised weak economic recovery. OPEC expects global demand growth of 1.1 mb/d and 1.2 mb/d in 2014 and 2015, respectively.

In ‘The Energy World Is Flat’ (Daniel Lacalle & Diego Parrilla, Wiley 2014), our forthcoming book, we highlight the end of peak oil from the combination of efficiency and ample supply. IEA’s World Energy Outlook shows that by 2035, the world can achieve energy savings equivalent to nearly a fifth of current global demand.

Yellen & Co. are literally grasping at straws to explain the ‘phenomena’ associated with (now) normalized employment and capacity slack/low inflation.

She might want to get out and visit some of the efficiency engines across the country, starting with online commerce. Silicon Valley/SF looks, smells and tastes what you would expect (bouyant labour and wage growth and sharper inflation), at the expense of much of rest of country.

Thisn has been regularly happening over the last 300 years. Productivity/technology led disinflation can be incredibly powerful.

Coming to your industry via substitution real soon.


Important Disclaimer: All of Daniel Lacalle’s views expressed in this blog are strictly personal and should not be taken as buy or sell recommendations.

Eurozone Banks Face the Toughest Stress Test

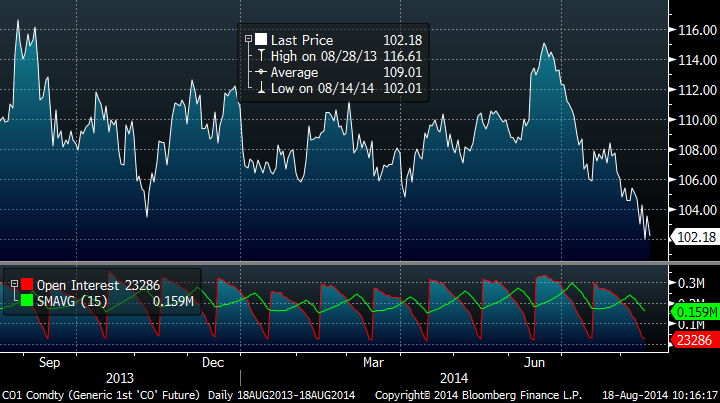
El Confidencial 26/7/14

“Stress tests are like Cuban universities, everyone passes, but the title is worth nothing.” 

If anything has been shown in the recent episodes of negative surprises from some European banks – from Portugal to France or Germany – is that European banks have not yet solved their problems. We confuse the important exercise of transparency and improvement carried out since 2012 with a magic solution to a problem created by a decade of excess. Is impossible to assume that banks have cleaned up their balance sheets when non-performing loans reach EUR 932 billion across Europe, 7.6% of total loans in the eurozone, according to Price Waterhouse Coopers .

When we talk about the bank stress tests (“stress tests”), many analysts regard them as the definitive marks, not as what they really are: a dynamic analysis of constantly changing circumstances . And, of course, these tests are not infallible, as we have seen so many times (Dexia, Savings banks, Cypriot banks, etc..).

WHAT IS A ‘STRESS TEST’?

It is an analysis that uses a common methodology for all countries, in which the impact on the capital ratio of a bank of various risk events is analyzed .

The general public tends to think of banks as “entities that collect deposits and make a lot of money,” and this is wrong. Because we tend to look at the P&L (accounted profit and losses), and not the cash flow and balance sheet.

A bank, for every Euro received from deposits usually borrows up to 25 times. That deposit is actually a loan, it is not sleeping in a safe.

For every Euro that the entity gives as a loan, banking rules allow the use of more or less capital depending on the risk that is assumed for the operation. If the bank lends to a very safe company with a low probability of default, the percentage of capital required for the loan is very low. The rest is debt.

These loans, if they work, generate a profit, and during the life of such loan the bank generates a margin between the cost of money and the interest rate charged… if the bank gets the principal back. If not, the balance sheet will deteriorate rapidly.

Whhen things go wrong, such “capital” shrinks very quickly. This is why people do not understand how in 2007 a ​​bank could have reasonable solvency and liquidity ratios and in 2008 be on the verge of bankruptcy. A citizen does not see how fast the core capital can disappear when a large percentage of loans become risky (non-performing), which means that there is a high degree of probability that the borrower will not be able to pay the interests and principal. This rapid decline in the middle of a recession can leave the bank without resources.

As such, stress tests aim to analyze whether in a drastic change in the economic environment, banks would retain the 10-11% of capital that they have on average today.

WHAT DOES A ‘STRESS TEST’ MEASURE?

The stress tests aim for two objectives. Firstly, analyze the impact on banks’ fragile financial structures of events like a recession, losses on sovereign bond portfolios, aggressive currency depreciation, etc.. Furthermore, the test stress tries to be righteous enough to not make an unnecessarily negative exercise that endangers the public trust in the institutions.

WHAT DO BANKS FACE IN THIS ROUND OF TESTING?

Many large banks are currently generating returns of around 4% (return on equity), far below the typical target levels of around 15%.

Research by EY suggests that banks will find it extremely challenging to achieve this kind of RoE uplift. Cost reductions of around 35% or revenue growth of more than 20% might be required just to achieve their average cost of equity (10%). Should banks wish to reach 15% RoE they would be required to reduce costs by 66% or grow revenues by 44% — a goal beyond the scope of most banks in the current climate.

A problem of low Return on Equity (peripherals around 2%, average eurozone banks below 6%)  and high exposure to government loans is not solved in two years, but deposits have stabilized and banks have sold large packages of toxic real estate assets. That does not make the sector “totally healthy”.

The stress tests of 2014 will be very demanding and assume , among other risks:

  • An adverse scenario of falling GDP in Europe of 0.7% in 2014, -1.5% in 2015, plus a 21% drop in house prices, added to increased inflation.
  • Losses in the portfolio of sovereign bonds from increases in their risk premiums. Increases of 150 basis points in European premium or 200bps in the US sovereign bonds. Assumes a drop of 6.5% off in Spain, for example, 6% in France and 7.6% in Italy and 4.4% in Germany in the 5-year bonds.
  • Possible 25% depreciation of the Hungarian and Polish currencies , and 15% of the Czech, Romanian or Croatian.

Although these may seem aggressive estimates, the expected impact on banks is relatively small .

However, do not forget that these exercises are theoretical and, like everything else, reality often shows unexpected effects. But the exercise is important.

Do not expect the credit will grow dramatically because banks pass the theoretical examination of the stress tests.

Although the level of private credit has begun to recover slowly, with an expected growth of 0.5% to the private-sector, 4.4 billion euros in 2014 -, the European Union remains, by far, the most bloated financial system in the OECD.

  • European banks are the most intervened, regulated ans State-controlled of the OECD. Not only due to the weight of public sector banks, but because of the disastrous intervention in the M&A and divestment processes , with governments pushing to lend at all costs. let’s not forget the “crowding out” effect of government debt versus households and businesses, encouraging the purchase of sovereign debt through regulation, as explained here  and in English here.
  • In Europe the banks finance 80% of the real economy , while in the U.S. is about 30%.
  • Total assets of the banking system of the euro area accounted for 349% of GDP in 2013 . A reduction of 12% since 2008. Much higher than the U.S. or Japan (Chart courtesy of Merrill Lynch) figure. While it is true that part of it is because European banks have more deposits, it shows a bloated banking system.

  • Additional credit expansion is not the solution , as we forget where we came from … A brutal credit growth since 2001, as the graph below shows (mdbriefing.com). Morgan Stanley estimates that European banks have sold or refinanced only between 20 and 25% of the 700 billion of non-performing loans that the regulation required them to urgently address in 2014.

Banks cannot drink and sing at the same time. It is impossible to strengthen balance sheets, avoid taking excessive risks while lending like 2008 just because we think that credit is the solution. First because they can’t and second because they shouldn’t.

The stress tests of 2014 are not the same as those of 2011. European banks have improved.  Non-performing loans are expected to be reduced in 2014 while operating profit is estimated to be up 4.2% after three years of decline . The risks still exist, but it is not as severe as it was in 2011. Forcing to lend at any cost is a great danger.

Liquidity injections by the ECB do not solve a key problem. Where do we put all that money?  Europe has an average of 25% industrial overcapacity. When I asked on CNBC a senior manager of the ECB where they thought they were going to invest 400 billion euros of TLTRO, he failed to give me a single key sector where those funds would be deployed.

Credit is growing again, but it should not reach the levels of 2004 to 2010 again. As Von Mises said, “no one should expect that any logical argument or any experience could ever shake the almost religious fervor of those who believe in salvation through spending and credit expansion.” 

I’m afraid that with negative deposit rates, liquidity injections and stimuli, we aim to re-ignite the credit bubble before the European banking system recovers its strength. Then, when it bursts, we will surely blame the ‘free market’… and de-regulation. 

Important Disclaimer: All of Daniel Lacalle’s views expressed in his books and this blog are strictly personal and should not be taken as buy or sell recommendations.

US GDP Growth Estimates Plummet

Consensus US GDP


Finally…. consensus capitulates.


From The Wall street Journal morning ledger: “2014 is likely to go down as yet another disappointing year of economic growth for the U.S, according to the latest Wall Street Journal survey of economists. The 48 surveyed economists mainly cited the absence of a big spring bounce after a sharp contraction in the winter as the cause of the predicted slump. As the Wall Street Journal’s Kathleen Madigan reports, the July consensus of GDP growth of just 1.6% this year – adjusted for inflation – is quite a plunge from the 2.2% expected just a month ago. The forecasters estimate real gross domestic product grew at an annual rate of 3.1% in the second quarter, down from the 3.5% gain projected in last month’s survey. The consensus view sees growth of about 3% in the second half. “We were flat-lining in the first half,” said Diane Swonk of Mesirow Financial. “We are in another difficult year, instead of the ‘lift-off’ year we expected.” Along with the downgraded GDP forecast, respondents were evenly split about an upside or downside risk to their forecasts – something of a sea change from the results of the six previous months. In each of those surveys, about 3 out of 4 economists thought the risk was that the economy would grow faster than their forecasts expected. One problem has been the unexpected sluggishness of consumers.


According to the Census Bureau, New Single-Family Home Sales plunged -8.1% M/M in June to a seasonally-adjusted-annualized-rate of 406k homes.  On a Y/Y basis, new home sales fell -11.5% versus +2.6% previously.  Furthermore, it is important to note that there were significant downward revisions to the prior months.  The month of May was revised lower by a record -12.3% to 442k (504k prior), April was revised lower to 408k (425k prior), and March was revised lower to 403k (410k), representing a downward revision of -86k over the past three months!  There were monthly declines across the U.S., as new home sales fell in the Northeast (-20.0% M/M and -27.3% Y/Y), the South (-9.5% M/M and -17.4% Y/Y), the Midwest (-8.2% M/M), and the West (-1.9% M/M and -9.4% Y/Y).  (acc to Boenning & Scattergood)

Additionally… The expected capex recovery is simply not happening, as Morgan Stanley points out.

dismal capex

And here’s what I said on November 23rd 2013 in “The US Growth Mirage“:


The mirage of our days may be the expectation of 2.9% growth in the United States in 2014. And it also sells a lot.The US is growing. All is well. Unemployment is low. Expansionary policy works. Does it? Not only it is not, but the most important economists of the Federal Reserve are warning about it.Look at yesterday’s GDP by categories: The “headline” +3.6% growth hides a meagre +1.9% ex-inventories. Q3 Consumer Spending +1.4%, was the weakest since December 2009. Business Inventory added 1.7% to +3.6% GDP, the most since 2011. In fact, REAL FINAL SALES (CORE GDP, EX-INVENTORIES) WAS ACTUALLY REVISED DOWN TO JUST 1.9%. 

The perverse incentive to flood markets with easy money generates a massively leveraged economy (check margin debt, at record highs), moves capital to the financial sector and sinks productive investment. Gross Domestic Product (GDP) is becoming more like a soufflé , filled with air . Not only companies spend less, but the money is used to buy back stock, pay dividends and exchange capital in mergers and acquisitions, and not for added productive investment.

Between 1996 and 2006 the largest companies in the U.S. (S & P 500) invested about one trillion dollars per year, of which 70% was devoted to capex and R&D while 30% to buyback and dividends. Since 2009 the annual number of total invested capital has soared to over $2.3 trillion, but 45% is used to buy back shares and pay dividends. In fact, neither the figure of productive investment or R&D have increased substantially, inflation-adjusted, since 1998. That is, the ‘free’ money from the expansionary policy is used  for protection, reducing the number of outstanding shares, merge and return cash to shareholders, not to expand organically  (data from Goldman Sachs, Morgan Stanley).

The U.S. has created nearly half of all the money supply of its history in the past five years, and has lived the longest period ever seen without raising interest rates, and yet the labour participation rate (percentage of civil population of the United States with over 16 years of age or more who have a job or are actively looking for one) has fallen to 1978 levels, 62.8%. Some explain this due to “the demographic effect”. However, adjusting for these demographic changes -there are fewer young workers and the older ones are living longer-, the labour force participation and employment has not improved since 2010 while the country engaged in money printing like crazy. Improving unemployment by ‘taking people off the lists’, as in Europe in the early 90s. Meanwhile, almost half of the working population in the U.S. earns less than $40,000 per annum.

Private sector payroll

From Michael Purves: “Payrolls this week report came in with an impressive 203k gain and a 7.0% unemployment print. More importantly the jobs additions drew from a wide variety of sectors, including manufacturing, and not the lower wage and more temporary job additions we have seen in earlier reports.

The underemployment rate (U-6) also fell from 13.8% to 13.2%, representing the sharpest percentage drop  since 2008.   The most significant aspect of this report is not the numbers per se, but that the numbers were achieved in the context of notably higher interest rates.  However, there are still notable signs of  weakness: the participation rate (despite an uptick this morning) is still in a down trend, and we are still not seeing a significant improvement in average hourly earnings, or average weekly hours”.

Additionally, personal income decreased 0.1% and disposable personal income (DPI) decreased 0.2% in October.

personal income decreased

Monetary policy is proving to be a key driver of massive inequality, and benefiting only those that held assets or have access to massive debt.

The greatest swindle since the miracle medicine men of the Wild West is to say that monetary policy is redistributive and social. But do not worry, they say, “next year, it will be better”, “Just wait.” Look at the Hiring Plans Index since 2011 (graphs from MS).

Hiring Plans Index since 2011The balance of the U.S. Federal Reserve is rapidly approaching a staggering $4 trillion dollars, buying about a billion a year in bonds, yet the economy is growing well below its potential … but also that potential is deteriorating .

QE does not create jobs exhibit 1:

QE does not create jobs
Exhibit 2: Federal Reserve Balance Sheet Expansion vs Job Creation
Federal Reserve Balance Sheet Expansion vs Job Creation

In the last two weeks I’ve read two excellent reports from Federal reserve economists William English and David Wilcox warning about the deterioration of the actual and potential growth of the United States. The  graph of one of these reports shows how the correlation between potential and real GDP has broken, well below the trend from 2000 to 2007.

Potential GDP

Companies do not invest in productive activities and job creation because conditions for confidence are simply not there. Artificially low rates and printing money may deceive a few analysts, but not presidents and CEOs of companies that have been able to be leaders and global competitors despite any government interference.

Tax increases and financial repression destroy consumption, money velocity and job creation in the medium term.

Goldman Sachs estimates that in 2014 capex and productive investment will grow by 9%. Analysing estimates and guidance for 2014 of most S&P 500 companies, I doubt it. At best, it will be flat year-on-year.

Government cannot replace private sector capex. Despite the low government bond yields and eternal lift of the debt ceiling, the U.S. continues to generate a massive deficit, projected at around $744 billion for Fiscal Year 2014. To ‘fill’ the loss of productive investment, assuming -which is a lot- that governments would spend wisely- the deficit would have to shoot another half a trillion dollars, and with it comes higher tax increases, more financial repression and… less productive investment.

True, banks are stronger and have less risk and government is borrowing at low rates. Of course they are, with a QE that is an equivalent of 6.7% of US GDP as an annual gift.

Increasing money supply by 6-7% to grow GDP by 2% is not growth, it’s stretching the pizza dough. However, a problem of wrong incentives, creating fake money and artificially low rates not only dilutes the real growth but impairs its potential one. The solution that Keynesian economists offer? … Repeat. “Until investors give in” as Paul Krugman says. More fuel to the fire.

As growth is poor, what they propose is more booze to the alcoholic. Low rates forever. Yes, many members of the U.S. central bank, like Charles Plosser,  expressed doubts about the effectiveness of monetary policy, and begin to propose measures to control the madness limiting the ability of the Fed to buy assets and expand its balance sheet, but these are still voices in the desert. If you really think that forcing the machine will revive investment and job creation because it is decided by a committee, it will not happen. Until the job creators clearly see the opportunities, investment will remain low.

 investment will remain low

Reasons for concern:

  • Credit conditions are deteriorating alarmingly, which leads me to believe that productive investment will stagnate in 2014 . Estimates of increase of 9% do not agree with any of the messages thrown by the companies that published results and guidance.
Credit conditions
  • Deterioration of the leading indicators of job creation, new businesses, corporate margins and capex have accelerated since September and came into contraction long before the government shutdown.
  • Estimates of profits in the industrial and consumer sector have fallen between 8% and 10% for 2014.
  • In March, another drama on account of the debt ceiling and overspending  and no small risk of tax hikes. With the popularity of President Obama at a minimum-37% -, the likelihood of tax increases to ‘the rich’, which is always translated into ‘tax hikes for all’, is high.
  • The so-called Obamacare -mistakenly sold as the panacea of universal public health-, means about 52 billion dollars in new taxes to small businesses in particular, and the lowest estimate of the negative impact on employment that I have read is 800,000 people .

Yes, I know. For the stock market investor most of this is irrelevant. The worse, the better, and $85 billion of monthly asset purchases by the Federal Reserve, even if it is trimmed, makes everyone happy because the ‘helicopter money’ only helps the financial sector and the state, so we will ‘party like it’s 1999′ for a while. Furthermore, investors are protected by many companies who do not fall into the trap of easy money, because they are the first to suffer when the music stops.

I am sure that the innovative spirit of the country will prevail, but to estimate its economic development through the moves of a stock market impacted by share repurchases and ‘laughing gas money’ may be an illusion. Richard Koo warned that the U.S. is engaged in “the QE trap” from which you can not get out easily or comfortably. As Fleetwood Mac … Can’t Go Back.


Important Disclaimer: All of Daniel Lacalle’s views expressed in his books and this blog are strictly personal and should not be taken as buy or sell recommendations.