14th July 2011
The figures add to concerns that the Chinese government will slow growth with a sharp tightening of monetary policy, in response to consumer price inflation running at 6.4 per cent last month despite five interest rate rises since October.
Meanwhile, Saudi Arabia has increased production to a record 9.6mbpd, an increase of 800kbpd from January, and Iraq reached record output of 2.75mbpd, almost back to pre-war levels.
As of June, IEA inventories remain above the 2006-2010 average.
However, I still receive doomsday messages about supply. And I say, don’t worry, supply is adequate.
Now the Shale Oil revolution is upon us.Remember what shale gas did to natural gas prices? Down 54% from the peak. Imagine what shale oil can do.Peak-Oil defenders, gas lobbies and environmental groups all said shale gas was not economical below $8/mmcfe, they said that it was a “bluff” and that the decline rates would make the “fad” disappear as soon as natural gas reached $6/mmcfe. It reached $2.5/mmcfe (now at $4.5) and the rig count is at all-time highs (890), companies continue to make good returns (18% IRR) despite pressure pumping and service costs rising, the environmental concerns are being addressed swiftly and adequately and decline rates have proven to be significantly less aggressive.
The NY Times battle against shale gas, driven by half-truths and questionable analysis, is lost. No one denies the massive resource base, even in Europe and China, and the opportunity to supply cheap, abundant energy.
Well, shale oil could generate a similar transformation impact for the oil market.
Last Thursday we met in London with twenty North American oil companies and a representative of the Energy Information Administration (EIA). We only talked about one issue: the revolution of Shale Oil, which could be a transformational force in the oil market.
The United States has over 24 billion barrels of recoverable oil in shale and Argentina over 200 million barrels of recoverable shale oil. Abundant oil supply delivered thanks to hydraulic fracking, a tried, tested and proven extraction technology. Companies like Anadarko, Oasis and Marathon are already developing shale oil fast. Repsol could benefit from this revolution in Argentina. First things first and let’s start with the U.S.
The oil sector is rubbing its hands at the prospect of a revolution which already generates 18-20% IRRs using a base price of $ 60/bbl.
Shale oil production in the United States has grown dramatically, from a modest 275,000 barrels/ day to an estimated 400,000 barrels/day in 2011 and up to 510,000 barrels/day in 2012. To give you an idea, this is the equivalent of Khursaniyah, one of the star oil fields of Saudi Arabia.
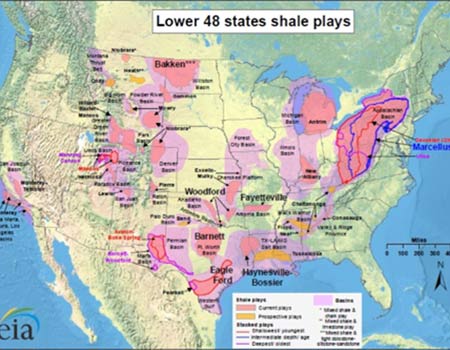
In a report published this week, the EIA estimates a level of productivity in the fields of North Dakota, Montana and Canada, together with Eagle Ford (Texas) that can make oil production reach very relevant levels in ten years, to the point where the US would halve its oil imports and its dependency on OPEC.
The figures are worth highlighting:
. With the improved hydraulic fracking techniques using recycled water and increased productivity, tight and shale oil is economically viable at $60/bbl. If we assume $100/bbl, each well repays its total investment cost in eight months. Three times faster than a conventional oil well.
. The oil industry alone will invest $25 billion in 2011 to drill 5,000 new wells. In 2012, the investment will reach $ 45 billion, giving employment to hundreds of thousands.
. Environmental concerns have already been addressed with the use of recycled water, isolation of aquifers and of drilling installations.
In Canada, there are several new plays popping onto investors’ radar screens, including the Mississippian Alberta Bakken/Exshaw shales in southern Alberta, Cretaceous Second White Specks in the Deep Basin, Jurassic Nordegg shales in the Peace River area of Alberta, and Devonian Muskwa/Duvernay shales in northwest Alberta/Deep Basin. On the more cautious side, Chesapeake quotes oil prices of between $30/bbl and $50/bbl being required to achieve 10% rates of return on different shale oil plays.
Who benefits from this revolution?
Anadarko , one of the best explorers in the world with the best track record of profitability in conventional and unconventional oil and gas, Oasis, small but very exposed to Shale Oil in Bakken, Marathon and Noble, two giants of exploration but more diversified, and the gas giants Chesapeake and EOG are all involved in very large acreage and moving fast in shale oil.
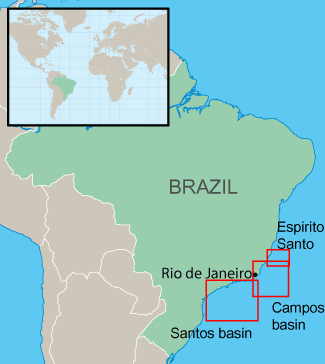
In Argentina, Repsol is prepared to follow the US-led revolution after announcing shale oil reserves of 150 million barrels recoverable. Of course, those reserves were already there and were known by the Repsol team at the time of the acquisition of YPF more than a decade ago, but what has changed is the development of hydraulic fracking techniques, horizontal drilling and the incredible expansion of the industry’s exploration and production of unconventional oil and gas, which has made productivity soar and the average cost per well fall despite the fact that pressure pumping costs have risen by c30%.
Of course, in Argentina the problem is the price at which they can sell the oil and gas under schemes acceptable to the government, but if the country wants to revive the economy, attract capital and recover the disastrous situation of domestic production, it has no other option but to apply international prices. But let’s wait, as history reminds us that logic does not always prevail.
YPF, Argentina’s Repsol’s subsidiary, will drill 17 exploratory wells in 2011 with an investment of less than $ 200 million. Assuming a 12% royalty and 35% tax, the Argentine shale oil can generate returns of 35% (IRR) per well at $90/bbl assuming a 70% oil and 30% gas content, the latter sold at the “bargain-price” regulated by Argentina for domestic consumption (about $ 2.60/mmbtu compared with $4.50/mmbtu in the U.S. and up to $11 in Chile). Of course, if prices are adapted to the international average, returns would be much higher.
For now, the projections of production in Argentina are negligible and the political and regulatory environment is still uncertain. Repsol has sold 45% of YPF to institutional investors and the Argentine Petersen group, hoping that the participation of local investors can help improve the situation for their business in Argentina. Hopefully that will work.
For Repsol-YPF it will not be any problem to access enough water for extraction on a massive scale, as there is more than enough in the area of Neuquen. The risk, of course, is the annoying habit of the Argentine government to seize profits when things work, so the presence of local investors can mitigate this interventionist “temptation”. We’ll see. But the other major unknown is how much will they have to invest to bring these reserves into production. A rough initial estimate of a development plan with 200 wells per year would mean an average of $2.8 billion annually (if the wells are multi-stage horizontal). And if Repsol invests aggressively in shale oil they might forget about questionable experiments in wind energy and marine algae, something that investors will appreciate.
Update:
Repsol announced on November 8th 2011 its “largest ever oil find”, with an estimated 927mb of recoverable resources (741mb of oil, the rest gas) in a 428 km2 exploration area in the Vaca Muerta shale formation on its Loma La Lata licences. In addition, it has started exploration on a further 502 km2 where it sees “similar potential” to the first area.
YPF has started exploring an additional 502km2 area, where its first well produced 400b/d of oil. Repsol believes that this new area has “similar potential” to the first area.
This oil would be sold at $60/bbl at the fixed price set by the government.
On February 8th 2012 Repsol’s subsidiary YPF announced 22.807bn boe of prospective resource, 1.525bn boe of contingent resource (1.213bn net to YPF) and 116Mboe of 3P reserves. The contingent resource lies in the 2 areas previously highlighted by YPF called Area 1 and Area 2. YPF highlight that Area 1 and 2 require 60 new drilling rigs and a $28bn investment (capex and opex) to develop. More would be needed for gas. The key remains whether there will be an adequate pricing/fiscal system to allow the investments. The update from YPF comes after government plans, as highlighted by Argentina’s Planning Minister Julio De Vido last Saturday, to force oil and gas companies to operate at full capacity even at a loss and follow new operating guidelines.
Shale oil could reduce dependence on changes in OPEC quotas and become the “cushion” to buffer the volatility of oil as the North Sea oil was a decade ago.
Shale oil is more than a promise. The pessimists will say, as they said with the shale gas in 2006 or Brazil’s pre-salt in 2005, that it’s all a lie, uneconomical, overstated and that the world is running out of oil. They are entitled to their opinion. Meanwhile Saudi Arabia has reached a record level of production of 9.6 million barrels/day, Iraq has surpassed 2.7 million barrels/day and Russia has surpassed 10.2 million barrels/day. And shale oil is upon us.
Further read:
http://www.eia.gov/oog/info/twip/twip.asp
http://energyandmoney.blogspot.com/2010/11/shale-oil-600-years-of-supply.html
http://energyandmoney.blogspot.com/2011/06/shale-gas-in-europe-poland-and-energy.html
http://energyandmoney.blogspot.com/2010/01/revolution-of-shale-gas.html
http://energyandmoney.blogspot.com/2010/10/has-cheap-gas-killed-renewable-star.html