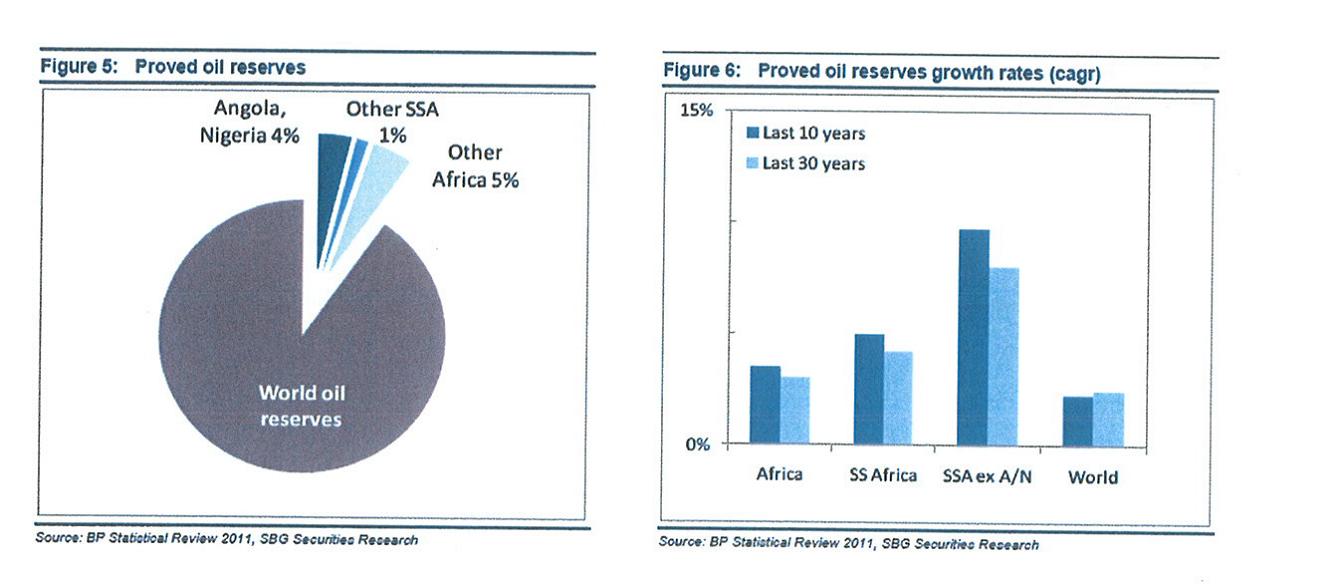
Sub-Saharan Africa has grown to represent a material reserves base, contributing 5% of total world proved oil reserves in 2010. Most of those reserves are located in Nigeria and Angola. Africaas a whole represented 10% of world total.
Reserves growth in sub-Saharan Africahas been faster than in the rest of the world in the past 30 years and has accelerated in the past 10 years while the rest of the world slowed down.
Sub-Saharan Africa outside of Angola and Nigeria was the world’s fastest growing reserves base in the past 10 and 30 years.
While representing 5% of total world proved oil reserves is material in itself, in contrast with some other regions of the world, most of the reserves in sub-Saharan Africa, as well as the opportunities for reserves additions in the future, are accessible to international investors.
- Apart from Oman, Yemenand Syria, most of the Middle East is closed to outside investment. Iraq is only slowly opening up to international explorers in the Kurdistan region and also to a limited extent in the south of the country;
- The FSU is open to international investment but in practice the best opportunities end up in the hands of powerful local oil industry players;
- In Latin America, Venezuela and Mexico have long been closed to international investors.
Only about a quarter of world proved oil reserves can be classified as accessible to international investors and that sub-Saharan Africa represents 20% of that accessible base.The picture is similar for gas with Africaas a whole representing 25% of accessible world proved gas reserves, which are about a third of total world proved gas reserves.
Reserves evolution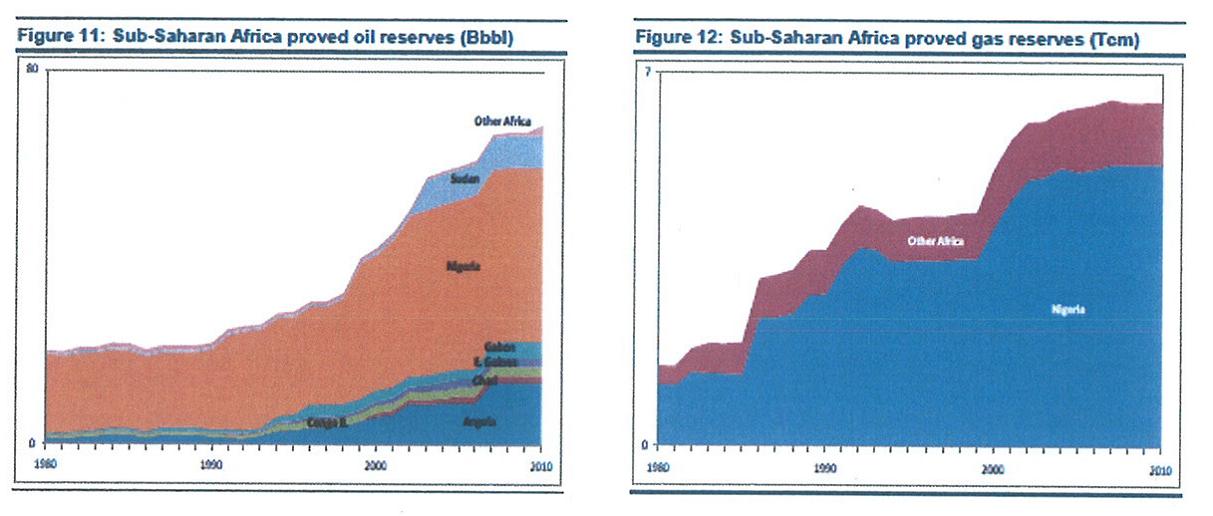
In 2010, proved reserves in sub-Saharan Africa were 69Bbbl of oil and 228TCF (38Bboe) of gas and represented 52% and 44% of African oil and gas proved reserves respectively, up from 37% and 25% in 1980.
Africa as a whole with proved reserves of 132Bbbl of oil and 520TCF (86Bboe) of gas represented respectively 10% and 8% of world oil and gas proved reserves. Reserves life in Africa was 37 years for oil and 74 years for gas versus world reserves life of 47 and 63 years, respectively.
While oil reserves are diversified across the continent, proved gas reserves are still largely dominated by Nigeria, although potential future gas producing provinces are being discovered elsewhere, e.g. East Africa. The emergence of export and local markets for gas in Africashould provide incentives for gas exploration and increase further proved African gas reserves in coming years.
Shale gasThe US Energy Information Administration estimates that the technically recoverable shale gas resources contained in the Karoo formation in South Africais 485TCF. However, given evacuation issues, demand being poor and low interest given the high reserves of conventional gas, shale is not an issue for now in Africa.
The South African Department of Mineral Resources announced in May 2011 a moratorium on applications for rights to explore for shale gas in the Karoo until it has formulated adequate policy, a process expected to take several months. No new applications will be accepted and existing applications will not be finalised until the Department has conducted the feasibility study.
Companies involved in exploring for natural gas in South Africainclude, Shell, Sasol, Falcon Oil & Gas and Bundu Oil and Gas
Production
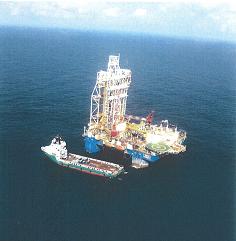
The growth of proved oil and gas reserves in sub-Saharan Africa in the past 30 years resulted in the growing importance of Africa as a major world hydrocarbon producer. Africa has consistently gained market share of world hydrocarbon supply to reach 12% of world oil production and 7% of world gas production in 2010, with annual production of 10.1MMbbl/d of oil and 1.2MMboe/d of gas.
Oil production in sub-Saharan Africa reached 5.8MMbbl/d and gas production 0.3MMboe/d in 2010 with oil production dominated by Angola and Nigeria.
M&AHaving realised the importance of Africa as a long-term hydrocarbon producer and in order to diversify their energy supply mix, the US and Chinaare importing an increasing proportion of oil from Africa.
Currently 25% of USoil imports and 30% of Chinese oil imports are sourced from Africa, and those proportions are expected to increase in the future.
Petronas, from Malaysia, was the first Asian company into Africa with its purchase of 30% of Engen Ltd, a South African firm, in 1996. The reason for this acquisition was to assist Engen in expanding marketing in South Africa, sub-Saharan Africa and along the Indian Ocean rim. Engen became a fully owned subsidiary of Petronas in 1998. Also Energy Africa was owned 56.5% by Petronas through Engen when it was sold to Tullow in 2004.
In more recent years, China has been the most aggressive in proactively becoming operators of African oil and gas production by acquiring existing operators and/or participating in exploration/production activities, using a number of different vehicles.
In 2009 Addax Petroleum was acquired by Sinopec, a Chinese petrochemical major, for US$7.2bn while CNOOC bought in the Ugandaoil development project together with Tullow and Total.
CNOOC was also interested in acquiring Kosmos‟ interest in the Jubilee field offshore Ghana in 2010.
Petrobras also acquired in Namibia and Gabon while Indian companies, led by public sector majors, have been also actively looking for upstream oil and gas assets in Africa, so far mainly as minority interest holders in upstream licences, e.g. in Mozambique with Anadarko.
In 2010 the Korean National Oil Company (KNOC) bought Dana Petroleum which had assets in Egyptand offshore Guinea, together with Hyperdynamics, a small US independent.
So far in 2009-2011 M&A activity has surpassed $58bn.WhyAfrica
- No OPEC exposure, so no risk to volume cuts.
- Supportive regulatory and managed legal framework.
- Strong business-driven mentality.
- From a costs perspective, finding and development costs across Africa are inline with world average of some US$15 per barrel of oil equivalent (boe), but lifting costs at US$4-9 per boe are lower than world average of some US$11 per boe
East Africa
East Africa could prove to be one of the most prospective regions globally.
By applying old ideas to new basins, Tullow/Heritage and Anadarko/BG, respectively, opened the multi billion barrel Lake Albert Rift system, Uganda and the Rovuma Basin, Mozambique/Tanzania.
Tullow and Anadarko’s successes have coincided with a push by many of the NOCs/IOCs to capture frontier acreage around the world as they seek to fill their exploration portfolio. In addition to the several pure-play East African E&Ps, current IOC/NOC acreage holders include Anadarko, BG, CNOOC, Eni, Exxon, Shell, Petrobras, Petronas and Statoil.
According to Wood Mackenzie in 2010, 3.5bn barrels of oil equivalent (+33%y/y) were discovered in Sub-Saharan Africa alone.
The largest contributions were Anadarko’s gas discoveries in Mozambique: Windjammer, Barquentine, Lagosta and Turbaro with the Rovumabasin accounting for half of all discoveries.
Anadarko’s find is large. Following the recent results APC is now saying that the Windjammer, Barquentine, Lagosta and Camarão complex now holds at least 10tcf, while Cove has been saying 12tcf (base) for a long time now. The companies are looking for an FID by end of 2013. If reserves are 12tcf a 2 train LNG development would be feasible and commercial.
Ophir provided higher-than-expected gas resources in Jodari in Tanzania (3.4tcf vs pre-drill estimate of 2.2tcf) de-risking concerns about the pace of gas discoveries needed for an LNG development.According to Afren “East Africa holds more than 31 billion barrels of oil, , three times as much as Brazil’s Tupi field”.
In addition to the 1bnboe already discovered within Uganda Tullow recently announced that it estimates that an additional 2.5bnboe of resource exists within the Lake AlbertBasin alone.
Moreover, a recently conducted independent report estimated that c.2.2bnboe of prospective resource existed in Block 10BA, Kenya, alone with an upside case of 4.4bnboe.
Furthermore, according to BP, between 1989 and 2009, Sub-Saharan Africa’s oil reserves more than doubled to 130 billion barrels.
East Africa deepwater
Big expectations in oil and gas from deepwater Mozambique and Tanzania after Anadarko’s Windjammer gas discovery confirmed the Rovuma basin as an emerging gas province.
With gas in nearby markets selling for $2-3/mcf, the lack of nearby infrastructure means that threshold commercial volumes will likely be high.
Much will be dependent on recovery rates per well (which can range from 50 bcf/d to 450 bcf/d offshore) but two subsequent gas finds (Barquentine and Lagosta) have already led to talk of there being enough gas to underpin an LNG development.
An even bigger prize is finding commercial oil after the Ironclad well penetrated a 38 metre column of oil and gas-saturated sands in one of two fan lobes of cretaceous sediments.
The ultimate prize would be the opening up of not only the Rovuma basin but also the other eight basins contained in the Mozambique channel which runs from Southern Tanzania to Madagascar.
Companies: (Mozambique) Anadarko, Tullow, Mitsui, BPRL, Videocon, Cove Energy, Artumas,
Eni, Statoil (Tanzania) Exxon, Statoil, BG, Tullow, Dominion, Aminex, Beach Energy, Orca
Exploration, Artumas, Maurel and Prom.
Guyana basin
The Equatorial Atlantic Margin play has its origins when Africa and South America drifted apart. Following success in Ghana and subsequently Sierra Leone (with the Venus well), the industry is now turning its attention across the Atlantic to the stratigraphic potential of the Guyana basin, which stretches across Guyana, Suriname and French Guiana. The main challenge is to define prospective traps along the migration path from mature source rocks. Much of the multi billion barrel potential is thought to exist in stratigraphic traps in tertiary turbidite sandstones and deeper cretaceous fan systems similar to the Jubilee play.
In French Guyana, Tullow found one of their biggest successes (Tullow operator, Total and Shell also partners) with resources (P10) of 700mb.
Companies: Exxon, Shell, Total, Repsol, Tullow, Noble Energy, Murphy Oil, Inpex, Petro-
Hunt, CGX Energy, Staatsolie (state energy company of Suriname)
West Africa
Many companies think that West Africa’s pre-salt geology mirrors that of Brazil.
The theory here is that the pre-rift geology below the sealing thick salt layer remained the same even after Gondwana separated to form Africa and South America. 3D basin modelling and geochemistry suggests a close match between West African and South Amercian margin basins in terms of pre-salt depositional sequences. This holds out the possibility of large pre-salt oil deposits in Angola, Namibia, Gabon and Congo.
Possibly the biggest proponent of this is Marcio Mello, CEO of HRT, who thinks that giant deposits in the pre-salt in Angola is “a certainty, not a possibility” with objectives in the Upper Cretaceous turbidite sandstones and syn-rift carbonates and sandstones identified that are analogous to the Tupi and Jupiter fields in Brazil. Sonangol and Petrobras recently started a joint preliminary study into the Angolan pre-salt and Sonangol has stated that it intends to drill one or two pre-salt wells by 2012. Petrobras and Cobalt hold African pre-salt acreage in Angola and Gabon whilst Repsol and Chevron are showing a strong interest through public statements they have made. It is early days yet but it does look like the risk capital will come.
In Namibia the biggest success so far has been the Kudu gas field (1.3tcf of proven reserves – Tullow, Gazprom main partners). However, the development is still undecided.
Companies: Petrobras, Sonangol, Cobalt, ChevronGhana
Tullow was responsible for the first major oil discovery in Ghana back in July 2007 with the Mahogany-1 well. The field was subsequently re-named Jubilee in honour of the 50th anniversary of the country’s independence from Great Britain.
Jubilee is now one of the most succesful and largest discoveries in the oil industry, holding 700 million barrels of recoverable resources with upside, according to Goldman Sachs, of 1.1 billion barrels.
First oil was produced from Jubilee just 40 months after first discovery – a world record – in late November 2010. A number of further discoveries have been made since then (including Tweneboa, Enyenra, Teak, Akasa and Mahogany East).
Jubilee is now producing at 85kbpd with ramp up to 120kbpd targeted for year end.
Field operations:Tullow’s field operations are based in Takoradi, about half an hour’s flight west of Accra. The site was formerly an airforce base, which Tullow now leases. Several oilfield service companies now have bases in Takoradi. I met with employees of FMC who are supplying the Christmas trees.Tullow managers and suppliers were both in agreement about the ease of doing business in Ghana. It has a strong rule of law, a straightforward customs process and Takoradi has modern and efficient ports (Tullow has dedicated berths).Given this accommodating background, Ghana could in time become a primary hub in West Africa for the oilfield service companies. Right now there are no supply chain bottlenecks.
Local content:
Ghana currently has a local content law in front of parliament, but nothing has been agreed to date. There was some discussion of this being as high as 90% but it is anticipated that the end result will be somewhat less onerous and, like Brazil, will vary depending on the specific product/service. However it is Tullow’s aim to stay ahead of the game in this situation.
Tullow has around 250 employees in Ghana, around 85% of whom are Ghanaian. Tullow has a very active education programme for local employees, many of whom are sent to the UK and elsewhere for training.
JubileeJubilee was designed to consist of three separate phases: phase 1, 1a and 1b. Phase 1 scope was an FPSO/subsea scheme planned to cost $3.15bn (the eventual cost was $3.35bn, or 6% over budget) with 17 wells including 9 production wells, 6 water and 2 gas injection wells. Plateau of 120kbpd was expected to last for around 2.5 years. Phase 1a adds a further 8 wells and is planned to extend production plateau to 2014/2015, while phase 1b will incorporate 10-20 wells and will either extend plateau or increase production.
The development plan for phase 1b depends to a large extent on the design for Mahogany East Area (Kosmos operated) as this could involve a second FPSO rather than producing through the current Jubilee FPSO.
Jubilee production ramp up – aiming for 120kbpdCurrent production at Jubilee is c85-90kbpd from 7 wells. The path to 120kbpd sees the following:
- One water injection and one gas injection well yet to be drilled, to be brought on by year end (adding c15kbpd);
- Production contribution from well J06, which has been completed and is waiting to be tied-back (adding c10kbpd+)
- Drilling, completion and tie-back of well J07 sidetrack (adding c10kbpd+). Tullow is pushing hard to achieve 120kpd.
Upside potential yet to be tested
Jubilee reserves and resources range is 500-700-1100Mbbls. While it is too early to tell whether the company could begin producing into the P10 case (phases 1a and 1b yet to be sanctioned and only 10 months of production history), Tullow is confident around the P50 number of 700Mbbls, saying that if things were going to go badly with respect to the ramp up and production levels, thus impact resource estimates they would know very early on and so far haven’t seen anything to give cause for concern. Aspects relating to recovery factor, such as effectiveness of water and gas injection will be the determining factors in achieving the upside case.
Key Drilling Campaigns 2012Tullow Africa Oil and Tullow’s Ngamia well discovered oil in Kenya. The well encountered 20m of net oil pay in Tertiary sandstones and is a significant play opener in Block 10BB. Pre-drill estimate was 45mmboe P50 and 180mmboe P10. 2012 drilling campain includes some strong high-impact wells like Paon-1 (Cote d’Ivoire) and Jaguar-1 (Guyana) plus multi-well campaigns in French Guiana, Uganda and Ghana
Afren has one of the busiest drilling campaigns this year, with the company looking to drill 13 wells across Ghana, Kenya, Kurdistan and Nigeria in FY 2012. Afren is currently drilling three wells Nunya (Ghana), Ain Sifni (Kurdistan) and an appraisal well in JDZ. Nunya is the most exciting well in the company’s drilling campaign for 2012, with pre-drill P10 estimate of 325mmboe. Afren will also drill the Pai Pai well in Block 10A, Kenya in H2 2012.
Ophir: 3.4TCF recoverable at Jodari is the strongest possible start to the five well 2012 Tanzania drilling campaign. Beyond Jodari-1, Ophir expects to spud 8 other wells before end 2012. These include 3 wells in Block R, Equatorial Guinea where are rig (Eirik Raude) has been contracted – the first well is to spud in May 2012. As a reminder, these wells are to prove up gas to feed a second LNG train in Equatorial Guinea. Preparations are underway for a more ambitious 12 well campaign in 2013, contingent upon additional financing.
Chariot: Expect Chariot (25%) to participate in the Petrobras-operated Kabeljou-1 well, on the giant Nimrod structure. Management hopes to continue drilling in 2013, from Delta-1 on the Central Licences, to the Zamba-1 well on the Northern Licences, which would test a separate play fairway to the Tapir Trend.
Other names like Africa Oil (Kenya/Ethiopia), African Petroleum (Liberia/Sierra Leone/Ivory Coast/Senegal), Chariot (Namibia), CGX (Guyana), Camac (Kenya/Nigeria/Gambia), Rialto (Ivory Coast), Pan Continental (Kenya), FAR (Kenya/Jamaica/AGC/Senegal) have intensive drilling campaigns throughout 2012.
Summary
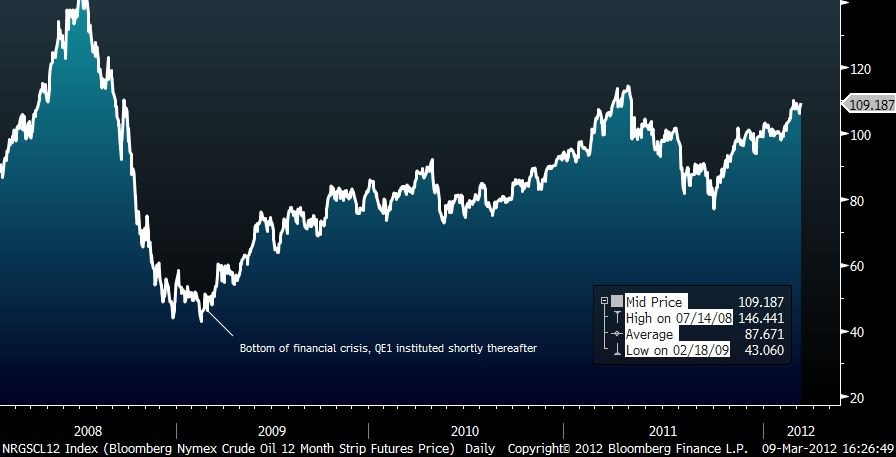
Strong oil prices and a desire to escape out of OPEC and Russia onerous contract types have led the oil Industry to explore further into Africa. The quality and volume of the discoveries has led African plays to become a hot topic in the market. I believe this will continues as a low cost, high quality resource is the most sought-after in the current oil world.
Afren, Tullow, Ophir, Soco, Cobalt, Chariot, Cove, Africa Oil, Hyperdynamics, Kosmos among others remain at the top of the list of the independents driving the Africa theme.
Sources:
. Tullow Oil
. Morgan Stanley
. Chariot Oil Gas
. SBG Securities
. Oriel
. Nomura