All posts by Daniel Lacalle
More on Peak Oil: Another (Valid) Opinion
Here is the response from a reader, Rich Lyon, to my analysis of peak oil (http://energyandmoney.blogspot.com/2009/11/peak-oil-realities-myth-and-risk.html):Ref: “Also, 60% of world oil production declines from 1.5 to 2.5% annually”
Rich says “May I draw your attention to IEA’s World Energy Outlook 2008 p.244 “It is necessary to estimate the underlying, or natural decline rate — the rate at which production at a field would decline in the absence of any investment — in order to ascertain how much capital needs to be deployed to sustain production or limit observed decline to a particular rate…The production-weighted average annual natural decline rate for the world as a whole is estimated at 9.0% — some 2.3 percentage points higher than the observed decline rate…At the world level, the increase in the production-weighted average decline rate over the projection period is about 1.5 percentage points, taking the rate to around 10.5% per year in 2030. That’s a halving rate of 7 years. Against any criticism you might make of the IEA, even CERA concedes 4.5% – a 15 year halving time. Schlumberger CEO used 8% in an internal newsletter.”
My answer: If I take the top producing projects globally the decline rate dropped from 4.5% to 3% between 2003 and 2010. Added to the improvement in recovery rate seen in Russia we achieve a 2% annual decline. It’s documented in our analysis of the main fields and in Goldman Sachs Top 330 projects as well. Schlumberger, like any oil service company, benefits from decline by taking more projects and increasing engineering. Their analysis might be interesting but not conclusive.
Goldman’s analysis of the industry’s new legacy assets has grown from 91 bnboe in Top 50 Projects (June 2003) to 565 bnboe in Top 330 Projects. They estimate that these projects will deliver around 62 mnboe/d of production by 2020E (46% of current global oil and gas production)
In the Top 360 Project report (2012) decline rates are analyzed:
Decline rates have changed dramatically in the non-OPEC supply base over the past ten years and our forecasts. These declines are calculated by subtracting major new start-ups (Top 360 projects) from historical production, to estimate the base decline including enhanced oil recovery, satellites and small field developments. It is interesting to see that since 2008 the decline rates have improved and stabilized around 2.0%. This is the result, in our view, of increased spending on the production base and of debottlenecking of the service capacity.
Source of graphs above and below: Exxon
Exxon, who are well known for being prudent and conservative, sees 2010-2040 global oil & gas supply: +5.3% pa (unconventional), +4.8% pa (heavy/oil sands), +3.5% pa (LNG), +2.8% pa (deepwater) and +0.3% pa (conventional)
Ref: “but global investments between $720 and $750 billion a year in oil and gas have also seen an unprecedented discovery and addition rate”
Rich says “In fact a perfectly good precedent exists – the discovery rate that was achieved in the period between 1940 and 1970, when global discovery rate rose from 5 billion barrels per year to 55 billion barrels per year. The rate of discovery peaked in 1968 and has followed a consistent 5% per annum decline rate ever since, punctuated by the isolated basin discoveries of Prudoe Bay and the North Sea, the recapitalisation of the FSU, and the modest (and now declining) contribution from deep water technology. It is perfectly straightforward to work out what discovery rate would be necessary to sustain 1.5% demand growth – about three North Seas every five years, commencing ten years ago. As it happens, that is the same discovery rate as they achieved 1940-1970. And, as it happens, the “unprecedented discovery rate” to which you allude is a pale fraction of that”.
My answer: The chart shows two distinct flaws. First, a 5% decline, and a 1.65% pa growth of demand.
Let’s start with discoveries. An average of 3 bnbls of oil were discovered each year in 2003-05, vs.8 bnbls in the 2006-09 period (IEA, Goldman, CERA) .Most of the discoveries over the last five years have been made in the deep offshore, with Brazil dominating on size, followed by the Gulf of Mexico and Ghana. Onshore discoveries of large size have been rare and in general limited to Iraq (Kurdistan) and Uganda, although oil shales and field redevelopments in Iraq have provided very material additions to the pipeline of onshore oil projects .
Additionally, the old trend of delivery with only c.75% of the promised volumes delivered after five years has massively changed and a new trend of c.95% was identified 2005-2010 (Goldman). This proves that the “below to above ground” analysis of many peak oil defenders is not linear and that industry technology and delivery has massively improved.
The analysis you mention focuses only on conventional oil as we knew it in the late 90s… why? Not clear. Why don’t we disregard any oil that is not onshore Saudi Arabia? why not disregard any oil that is not API perfect?. Very much in line with most peak oil theories, the analysis you ention completely forgets non-conventional and liquids as “inexistent”. Just the addition of shale oil resources and heavy oil in Venezuela and Iran have brought reserve replacement well above 120%. In addition to that, the giant discoveries in West Africa have added to the base of low sulphur crude.
To ignore non-conventional, pre-salt and heavy oil would be the same as ignoring deep water in 1970, or ignoring oil sands in the 80s. Drivers and motorists do not make that distinction as it’s as valid (if not better, given the excess capacity at high complexity refineries of 8mmbpd there is plenty of processing available at cheap cost) as a fuel as anything else. And EROEI analysis is available in this blog as well here http://energyandmoney.blogspot.com/2011/06/peak-oil-defenders-most-overlooked-myth.html.
Further read from Robin Mills: http://www.thenational.ae/thenationalconversation/industry-insights/energy/flawed-views-on-peak-oil-rear-their-ugly-heads-again
Ref: Inability of the oil industry to catch up with “growing demand”
Rich points to this chart:
My answer: The first thing I will question, as I have since 2003, is that “perennial growth of demand” of 1.6%pa. Demand moves in cycles and is not uniform. The lack of understanding of demand cycles and ignoring fuel efficiency as it happens is a key driver of the perception of scarce supply.
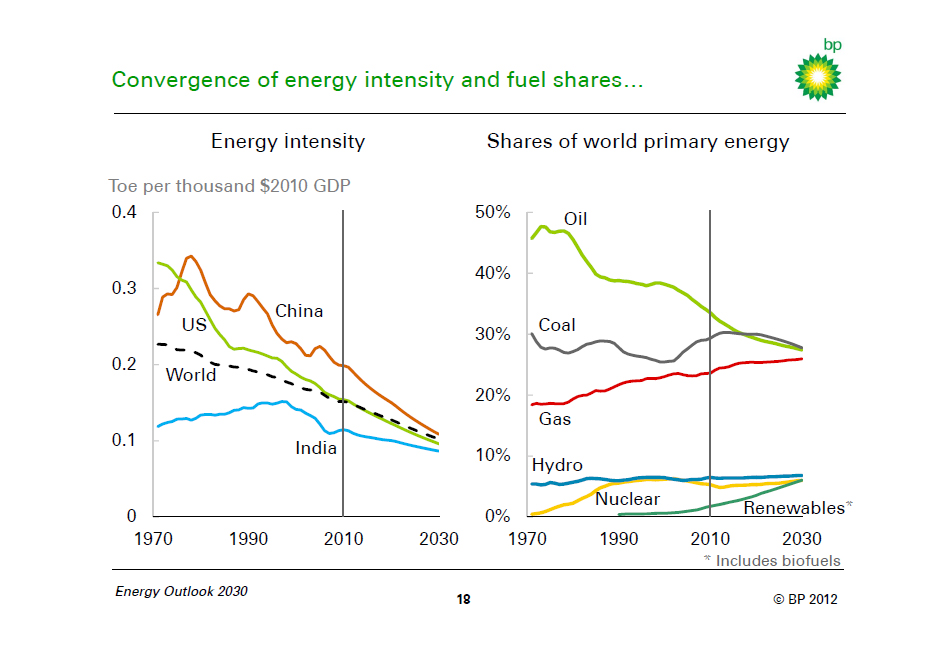
I am a firm believer of peak oil…demand. The assumption that demand growth will be linear and exponential and that the millions of new inhabitants of the world will consume as many barrels of oil per day as the Americans is simply impossible. First, efficiency continues to drive the transport industry, second, new technologies and alternative energies create a completely different scenario. We have not even talked of natural gas vehicles, but the reality is that when emerging markets reach the level of maturity in their economies that the OECD has, average oil consumption per capita in those countries will also be well below the current US-EU level. In our calculations average oil consumption per capita declines by 6%pa due to efficiency and alternatives:
a) IEA long-term demand estimates have only been going down since 2005.
b) Growth of demand in Asia and EM is mostly offset by OECD decline, and the added growth is slowing down, as evidenced in China. More importantly, the “China angle” assumes that every city in China will consume 23bpd per capita. This is overstated by the fact that all major cities in China consume already that figure, and it’s slowing down, and like in Europe you cannot assume that the inhabitants of South Spain will consume as much as the Madrid citizens. It’s not an averaging up to the maximum, it’s an averaging down, as evidenced by efficiency impact in the US, where GDP grew 3% pa for a decade without a meaningful increase in power demand. Oil demand in the US went from 15mbpd to 18mbpd (a mere 3mmpd increase) in the period of highest GDP growth and monetary expansion (1970-2011).
c) Growth of demand in EM is overstated by the assumption that they will move to consume 23bpd per capita. If, as I expect, world consumption stays virtually flat to 2030, there would be no evidence of a supply problem.
Rich says:
Hi Daniel – I note your trick in the Saudi graph of starting the y axis at 6 rather than zero to exaggerate the appearance of an increase – a common statistical illusion. Saudi has about 15 million barrels a day of production capacity and 10 million export capacity – recent exports of 8 merely reflect demand stagnation, and your “rocketing” exports is in fact it reverting to its saturated maximum output.
Of far more interest is the erosion of export capacity by soaring internal demand, driven by Saudi population growth compounding rising cooling and water desalination power requirements. Saudi export capacity in fact falls to zero by 2030. Which is why Saudi is commissioning 16 nuclear power stations a conventional missile strike away from Iran and Israel. Details for your more curious readers here: http://richardlyon.net/blog/2012/02/10/end-saudi-production/
My answer: Saudi production increase, of course, is, as it always has been driven by demand. You can read in my post http://energyandmoney.blogspot.co.uk/2012/03/us-talks-of-releasing-strategic.html how Saudi production has behaved when demand has been there.Saudi Arabia is not an
NGO and does not need to “prove” its capacity, neither needs to help to artificially lower oil prices for the sake of OECD consumption, when they have to take care of their own budget and population needs. The key for peak oil and the debate is that, since 2005, I have been reading of the “inability” of Saudi Arabia to reach 10mpd production, even saying that its production would fall below 8mpd. Well, here it is… when it’s needed. Forgetting that OPEC is a cartel and Saudi Arabia a part of it, and that supply will only be added if demand is stronger and sustainable, is the key differentiation between my opinion and the argument of “inability to produce more”. Furthermore, if Saudi resources were depleting as quickly as predicted by some and for such a long time (since 2001), this recent increase in production would have been technically impossible.
Also, on Saudi Arabia’s exportable capacity, the assumption of exponential demand growth in my view is also questionable. Saudi Arabia already consumes oil above the per-capita demand of many OECD countries. Efficiency will also erode that exponential growth and you will likely see solar, gas and nuclear be added to the energy mix not due to “lack of capacity” but driven by a logical generation mix planning, just like the mix we have in most countries. Saudi Arabia is expected to increase electricity generation capacity to 80 gigawatts, driving primary energy intensity from 257 (EU=100) to 150 by 2020. The efficiency of the power sector (thermal power plants) has regularly increased over the period 1990-2009, rising from 27
percent to 31 percent. I personally have Saudi Arabia peaking its oil consumption in 2015. More in detail, I see demand in The Kingdom going from 83.73 bbl/day per 1,000 people to 68 by 2020, still a high EU-type of consumption per capita.
I would like to thank Rich for his polite, informed and interesting comments. It was a true pleasure to discuss with him. You can follow Rich on the following blog: http://richardlyon.net/blog/
Here is my interview on CNBC:
http://video.cnbc.com/gallery/?video=3000076989
Further read:
http://oilprice.com/Energy/Crude-Oil/Why-is-Obama-Lying-About-US-Oil-Reserves.html
http://www.businessweek.com/magazine/everything-you-know-about-peak-oil-is-wrong-01262012.html
From Zerohedge:
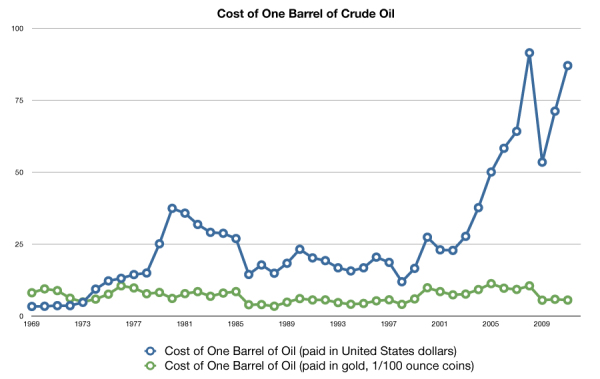
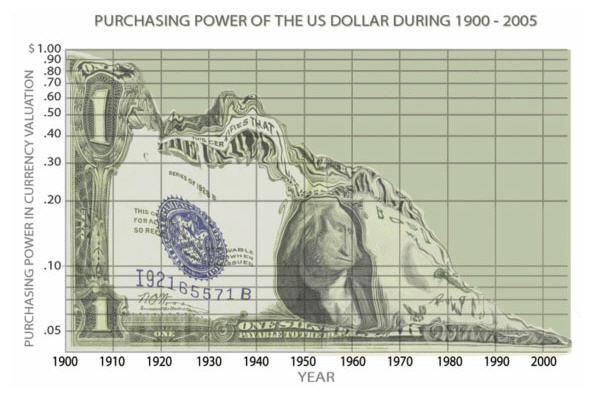
They might cite the idea that oil prices are much higher than they were ten years ago. Yet this is mostly a monetary phenomenon resulting from excessive money creation beyond the economy’s productive capacity. Priced in gold, oil is still very cheap — almost as cheap as it has ever been:
Oil Prices Reaching Breaking Point For The Economy?
I just came back from a trip to New York and investors concerns about energy and oil prices were clearly at the top of the agenda.
Who’s to blame for the current oil price?. Supply? demand?. Mmmm. I have a feeling that the blame this time is on Mr Draghi and friends in UK, Norway, Australia, US, with the ongoing mass liquidity injections and QEs, all driven to generate inflation one way or another, and driving investors to increase net length in crude.
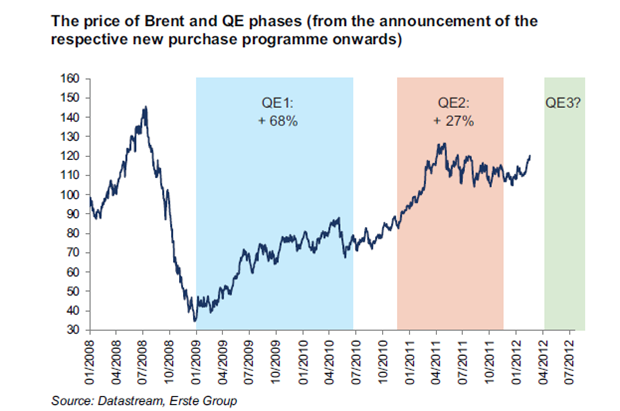
Oil prices reached all-time high in Euro and in GBP last week. All US media is mentioning high gasoline prices and it’s a permanent fixture in Europe news. If sustained, the price increase since December could trim 0.25-0.5% from annualized real GDP growth over the next year. Moreover, the combination of a stronger world economy, massive liquidity injections and quantitative easing programs with increased tensions in the Middle East suggest that a bigger shock is less of an issue than in the past.
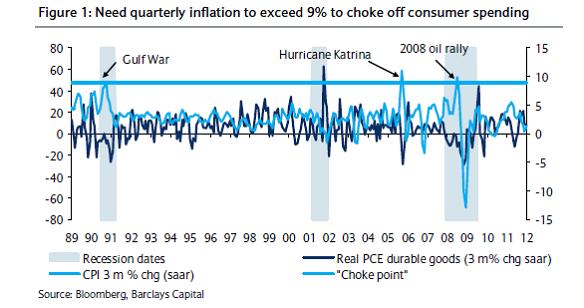
Barclays highlights that “it is not necessarily the oil price itself that can pose a threat to economic growth but the pace of its growth that is more important. It is the sudden surge in oil prices that leads to an abrupt shock to consumer spending and economic growth. Consumer durable spending, the most sensitive component of spending, fell sharply when the 3-month annualised change in headline inflation exceeded 9%. In each case, the price of oil rallied in excess of 40% over a 3-month period. In contrast, the latest geopolitical fears have, so far, led to a 20% rally in oil” …and inflation is way below 9%, at 3-5%.
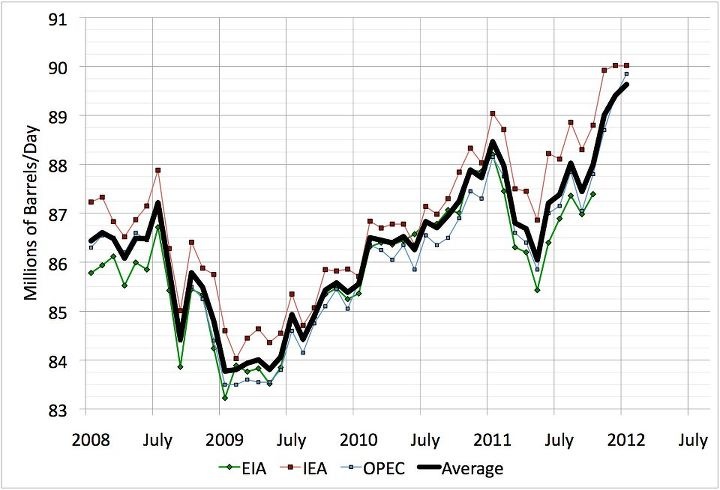
Let’s start with supply. Global oil supply, despite Iran, Syria and Lybia is at record levels. Not only Russia and other producers are keeping the pace strongly, but OPEC is producing at all time high, as per the figure below:
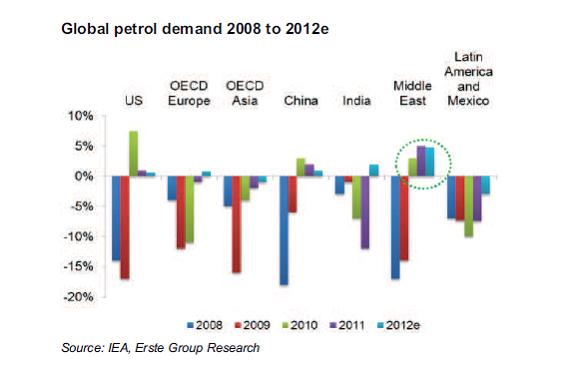
What is interesting is that, outside of the Euro crisis, the world’s economies are behaving much more strongly than expected but oil demand is not reacting. Efficiency comes to the fore. What many call “weak demand due to crisis” is in many cases, US being the clearest, a relentless improvement of efficiency. See below:
Additionally, the US imports reached a 12 year low last year thanks to the shale oil and gas revolution we have mentioned many times in this blog. The US imported 8.91m barrels a day of crude oil last year, according to the US Energy Information Administration, the lowest amount since 2000. US and Europe implied demand is down between 5 and 7% yoy, while Asian demand is pretty much unchanged. Emerging markets are keeping global oil demand above the 87mmbpd, but every two weeks we read from the IEA or other agencies that they are lowering their demand estimates for 2012. The IEA said it expects oil consumption to rise a relatively poor 800,000 barrels a day, or 0.9%, in 2012, according to its latest monthly market report. That would be 300,000 barrels a day less than the IEA forecast just a month ago. As we said at the beginning of the year, I expect demand to be flat year on year.
Inventories at the OECD have been shrinking recently, but remain within the average band of the last five years, 57-60 days of demand covered. The market is tight but not excessively tight, as prove by the fact that demand is well covered despite geopolitical disruptions in Iran, Siria and Nigeria.
|
CFTC Non-Commercial long/short net positions (21st February)
|
CFTC MANAGED MONEY net positions (21st February)
|
ICE Brent long/short net positions (14th February)
|
|||
| Crude |
228,180 (prev 204,752)
|
215,802 (prev 202,222)
|
Non-Commercial |
105,901 (prev 93,673)
|
|
| Nat Gas |
-124,929 (prev -126,157)
|
-70,832 (prev -72,314)
|
Managed Money |
96,703 (prev 88,706)
|
|
| Gasoline |
90,298 (prev 87,696)
|
91,640 (prev 88,575)
|
|||
| Heat Oil |
27,566 (prev 23,544)
|
43,207 (prev 39,379)
|
|||
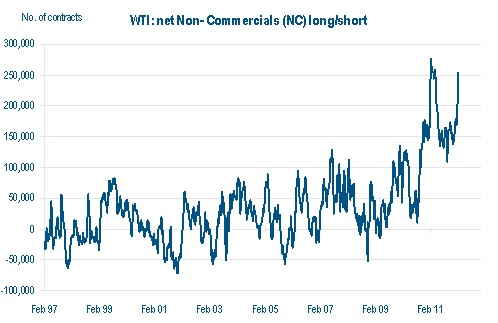
One of the areas that interests me the most is the growing net long interest in crude, reaching levels close to 2008. The inflation trade is on and the carry trade is guaranteed by the insane monetary policy and low interest rates “for the foreseeable future”.
Think about it. Monetary supply is growing so fast, from China to Europe, because the developed world is worried about deflation, that we cause inflation in all commodities (except regional and local ones like US natural gas). The balance sheet of the ECB has multiplied by 3 since June. Monetary supply is twice as high as it was at the end of the past decade.
 According to seeking alpha (see link here): “Developing China’s M2 money supply has been rising by a large 20% and Russia’s by a very large 30%.Even developed countries such as Switzerland have seen money supply growth of 25%. Japan’s M2 is gradually moving higher after the ‘Lost Decade’ and after recent events exacerbating an already fragile situation. Global money supply growth is increasing by 8%-9% per annum”.
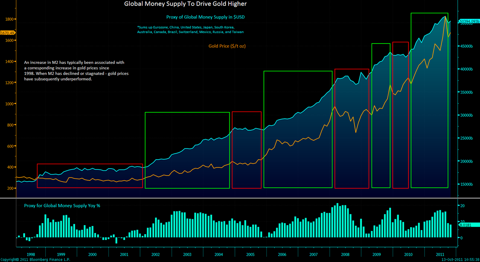
Then we go to the issue of “the oil burden” or the import bill versus GDP. It’s currently close to 5%, but the share of the oil burden in the OECD is diminishing, making high oil prices less risky for the recovery. Meanwhile, in emerging markets, high oil prices are also a less of a problem as the oil consumption generates products, goods and services of much higher productivity and higher added value. Remember that most emerging economies do not “need” low oil prices, that is more an OECD construct. Those economies have lived with high energy prices for a long time. When the oil burden reaches 7% is when we can start to worry. So far, demand destruction is a concern but not a worry.
Obviously, many of those emerging economies are also oil producers. Russia, Brazil, OPEC, West Africa and Asia are main beneficiaries of a wealth re-distribution out of US-Europe and into new markets.
Brent-Urals has gone negative this week. In this environment, the trade is likely to be negative European refiners. Another trade starting to look attractive is long WTI short Brent as the tensions with Iran are played out and inventory issues at Cushing start to be solved. I do not expect the differential between Brent and WTI to go to zero, but closer to $10/bbl, which is more fundamental, as we mentioned in this blog here (http://energyandmoney.blogspot.com/2011/02/brent-wti-spread-more-fundamental-than.html).
Finally the other attractive trade that seems to be unwinding is a short European Big Oil after the companies showed no meaningful free cash flow generation at the 4Q results and poor refining and downstream margins added to sub-par production growth and upstream profitability. The sector is at the top of its trading range versus the market and the traditional strengths (balance sheet, dividend, safety) are still there but at much more demanding multiples. At 9.5xPE the sector trades at historical high EV/IC/ROIC/WACC. All above 1 (which means expensive).
Meanwhile the US is seeing the benefit of shale oil and shale gas in every part of its economy. Just a small calculation shows that the effect of WTI at $20/bbl below brent and Henry Hub gas at $2.5/mmbtu versus $8/mmbtu in Europe has the same effect as Bernanke’s trillion QE… annually. Read this. In Europe we continue to ban it. Someone in Washington must be laughing hard. The US refiners seem in the best place to take advantage of a strengthening economy and lower feedstock. So do the US oil names. As for US gas names, careful when asset (land) value collides with low earnings multiples, because M&A comes back…. except in joint-venture filled companies, because JVs are giant poison pills.
I believe the risk of demand destruction remains, but unlike 2008, the risk of a financial meltdown and a credit crunch is much lower, and in fact if there is any risk is that loose monetary policy will remain for the foreseeable future, keeping the commodity-led inflation high. Draghi, Bernanke and friends want the carry trade, and need it to avoid deflation in a japanese way. Supply and demand remain well covered, printing money is the wild card.
The IEA March report left 2012 oil demand forecasts unchanged, but highlighted OPEC’s ability to increase production, with OPEC volumes at the highest level since October 2008. OPEC supply in February was 1.3Mbpd ahead of the forecast call on OPEC for 1Q.
OECD inventories rose 13.6Mbbls in January and fell 26Mbbls less than usual in Feb. Furthermore, the IEA sees 625kbpd extra OPEC capacity by 3Q, adding to current spare capacity at 2.75Mbpd (Bernstein).
Data courtesy: Carnegie, Erste, Oriel, BP, BarCap, Bernstein and own research.
Here is my interview on CNBC:
http://video.cnbc.com/gallery/?video=3000076989
Worth a read:
http://energyandmoney.blogspot.com/2012/03/energy-disinflation-as-source-of.html#
Baltic Dry Index down 65% YTD. The single clearest indicator of the global overcapacity problem.
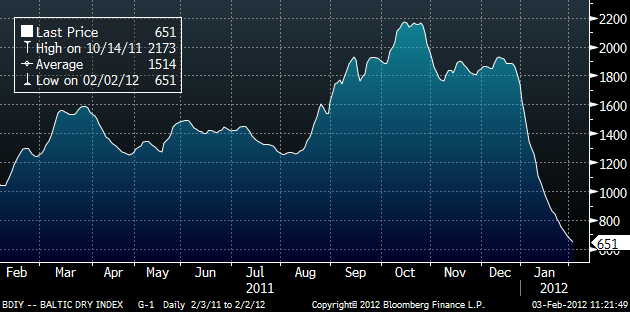
The Baltic Dry Index is down 65% this year and at the lows of 1986.
Main reasons:
a) Oversupply of vessels. While supply has increased an average of 12% pa 2008-2012, demand has been weakening -3% pa.
b) Weaker demand from China, added to high levels of stockpiles all over the OECD, with lower iron ore demand after strong inventory build in December. Inventories stand at 5 year highs. Just the outlook of dire demand from aluminium smelters is a big worrying factor. Despite the cuts in capacity of Alcoa and Norsk Hydro, the outlook for aluminium production is weakening for 2012-2013.
c) Weather issues in Australia driving lower vessel utilization (coal supply disruptions).
d) Commerce trends weakening from LatAm to Europe (-7%) and Asia to Europe (-6%) at the same time as new building of houses, offices and infrastructure is slowing down all over the OECD as a result of the overcapacity created by the stimulus packages (mostly devoted to construction) of 2007-2010.
The Baltic Dry Index neeeds to reflect the weakening outlook for metals demand, with Chinese steel demand growing by 4% in 2012 from 10.5% in 2011 and significantly below GDP growth of 8.4%.
In addition, the delay of the 90mtpa Siere Sul iron ore project for 2016 (from 2014) adversely affects the shipping outlook.
However, brokers still expect c6.5% growth of seaborne bulk commodity supply in 2012-13, driven by 9%+ growth for iron ore and c7% for thermal coal.
On vessel overcapacity, consensus expect the fleet to grow by 13.5% in 2012 and c6% in 2013, suggesting that the shipping market will start to tighten ONLY towards the end of 2013 IF demand picks up.
Rates for Capesize have dropped below $6k and the Panamax spot at $6.5k/day can barely cover operating expenses. Rates are below cash break-even for the largest part of the sailing fleet, and China seems very happy about it, as they drive most of the excess supply and benefit at an aggregate level as a lower cost.
Going forward, we will likely see a small “dead cat bounce” on the Baltic Dry Index once we see the unwinding of the China inventory build that happened pre-New Year holiday and once we see an improvement in weather conditions in Australia, but the underlying deep problem, overcapacity in vessels and massive unused and unusable infrastructure and construction, remains. The fleet is built for a growth that is unsustainable and unreal. The world’s iron ore consumption is not going to grow 12% pa to offset the overcapacity. I believe the small uptick, unfortunately, will be used by some vessel owners to take out some capacity (not enough) and maybe raise marginal day rates, still nowhere close to 2007 levels.