Category Archives: Energy

Energy

Calling the bottom on power prices in Europe

Although overcapacity in Europe plus excessive renewable installations remain the biggest threat to power prices, and a quick price recovery seems highly unlikely, these are the main reasons why i believe we could be reaching a bottom:

  • . I believe CO2 has reached a very strong support level at €13/MT. Utilities keep adding to their hedges at this level despite demand concerns. Even with -1% demand in 2010-2011 a CO2 price of €12-13/MT is widely accepted as a solid risk-reward price (basically the NPV of 2013 €23/MT with a 10% discount).
  • . I believe demand is showing some small but encouraging signals of bottoming. We have seen encouraging data from the countries with highest overcapacity like Spain and Italy. Demand data for Spain for June is down only 2.7%, versus down 8% in May. This is temperature and working days adjusted, so not influenced by external factors. Same trend was seen in Italy with June figures only down 3% adjusted.
  • . Capex cuts could reach 15% in 2010. Moody’s and S&P are demanding (expecting) power capex cuts in 2010 to reach up to 15% in Europe’s rated power groups. I had a chat with Neil Bissett from Moody’s yesterday in which they believed that generation companies should start thinking about moving closer to more cyclical company-type of gearing. That is c30% net debt/nd+equity!. Not only large groups are facing higher pressure to control capex and gearing, but smaller power companies are likely to be unable to finance agressive growth plans in current conditions. The effect is likely to be evident in 2011 and will hopefully bring reserve margins to tighter levels in Europe.
  • . Gas prices look well supported into summer by ongoing Norwegian supply discipline (and more worryingly, inability to offset decline) and revamped Russia-Ukraine dispute risk. However, winter looks uncertain. The gas market is the key uncertainty to this picture as it looks awful considering LNG.
  • . …But maybe the threat of LNG could be less agressive. You know me, I always trust Exxon, and so far it works. BP, Exxon and BG are seeing enough Asia demand to close large long term contracts. Additionally BP believes through TNK that Russian gas production could be peaking as reserves could be overstated. Exxon wants LNG in the US for two reasons: a) lower US gas prices benefit them and b) lowers the valuation of gas assets which they would takeover gladly.
  • . In coal we are seeing supportive data from recent broker comments of a tender for met coal out of Australia completed recently at US$132/t, which is the first deal above the benchmark price of US$129/t. Spot prices have rebounded from US$115–118/t last month, due to months of strong purchasing activity by the Chinese. Strong Chinese steel production, signs of an end to steel destocking in the world ex-China, as well as infrastructure constraints in Australia (Dalrymple Bay vessel queues up from 25 to 40 ships), have contributed to the move upwards.
US Natural Gas Dynamics

US natural gas is set to continue rising but fundamentals keep it capped at $6.5/MMBTU mid-term. The conclusion is that US gas is likely to be in a tight range of plus/minus 15% of the marginal cost of production (downside to $3.5/MMBTU and upside to a c$6/MMBTU short-term) as the contango flattens.

I would highlight three data points:

  1. Current 55-60% decrease in gas directed drilling activity in the US has not been sufficient to balance 2009 supply and demand. These rigs will gladly come back any time gas reaches $5-$5.5/MMBTU. Additionally, onshore rigs are being moved to Russia and West Africa, where there are stronger conomics. On the support side, coal-to-gas switching tends to kick off at $4/MMBTU
  2. Estimated base decline with current drilling activity (33%) can be misleading as production will still be c54BCF/day in the US in a worst case scenario and there is plenty of resources (if demand stays weak as predicted) in unconventional gas plus ample new reserves in the US (Marcellus, Barnett) .
  3. I do however believe the LNG “threat” is less than what market anticipates (although I am happy to assume 2-2.5BCF/d LNG into the US in 2010). Case in point is that all of consensus expects Chevron-Exxon’s Gorgon and BG’s Queenland Curtis to supply at sub-target ROCE levels (DB expects them to make 13% versus a target of 20%). This (in my view) is unlikely to happen as these are companies that ruthlessly monitor and manage ROCE, and have proven, to everyone’s surprise, that delays in LNG happen. The LNG overcapacity disappears in 2012 (no more LNG projects commissioned post 2011) so waiting and monitoring is not an issue.

European Power Reserve Margins

reserve marginsReserve margins are clearly acceptable in Europe, even to 2015, assuming capex as planned. There is however a risk of excess capacity if the economic slowdown continues beyond 2010 and renewable investments continue growing aggressively yet nuclear lives are extended. Capex cuts in liberalized markets should take care of this and it becomes a defining factor to monitor as new strategy plans are unveiled. In my view, current forward curves are justified by supply management (including in this nuclear closures) and demand recovery. If we doubt the recovery of demand, I believe capex management will happen more abruptly than estimated as companies become more aware of their optimal gearing.

In the past three weeks we have received data from different banks using the UCTE adequacy reference report. The unanimous analysis is that reserve margins in Europe are adequate assuming there is growth in demand. The positive outcome could be that the progressive increase in renewable energy and gas puts upward pressure on power prices, as well as the gradual loss of base load generation (nuclear, hydro from lower rainfall) relative to the overall generation park. However, renewables have proven to be less “positive” for prices due to perceived overcapacity.

The sector spends c33% of its market cap on capex every year in the 2009-2012 period. I believe we have seen the peak of capex and a move into managing existing assets and returns.

The reason why the forward curves on spark spreads remains positive comes mainly from the perception that demand growth will return in 2010 (driven by return of industrial sector) to a level of 1.2% pa and the general perception of a good oligopolistic nature of the sector in Europe, where companies can manage output. The interesting thing is that with current capex the reserve margins in all of Europe are solid.

Three things can put pressure on power prices:

. Renewable roll-out beyond requirement.

. CCGTs working at cash break-even to offset cost of take-or-pays.

. Demand flat beyond 2010 due to increased efficiency and lower industrial output.

In Europe under the conservative scenario used by UCTE, the adequacy reference margin rises from 50 to 59. More importantly, the “reliable available capacity” figure rises from 462GW to 521GW (a 1.1% annual increase for an expected total 1.5% annual demand growth).

This basically means that new capacity is expected to cover demand growth with no relevant impact in reserve margins. If demand does not return, capex cuts (or delays) can easily manage reserve margins in countries where companies control their investments with limited government intervention.

Two important facts to mention: a) Nuclear power availability comes down from 111.7GW to 96.7GW. This is because the UCTE assumes nuclear life will not be extended in Germany(where the reserve margin is expected to stay flat on new hard coal plants and renewables). B) renewable capacity seems underestimated. The estimate of EU increasing renewables (ex-Hydro) to 85GW seems very low. On my numbers we have 65GW of wind in European as at end 2008, with projections of 145GW by 2013. Today we have less than 10GW of PV but that could easily double or triple over the same period.

The worst country in terms of risk of overcapacity is Spain driven by the excessive installation of gas plants and renewables, driving reserve margins up c3% per annum, which basically assumed the optimistic demand scenarios Spain has enjoyed in the past. Portugal, and Italyto a lower extent, looks also at risk given the unnecessary roll-out of CCGTs and inflexible take-or-pays. This is a key element. As in Spain, companies have found difficulties renegotiating the terms of their gas contracts and take-or-pays remain at top of industry levels (75-25) despite some scattered successful gas contract re-negotiations (notably EDP with Sonatrach and Italians with ENI), but this is predominantly price more than volume.

Under normal weather conditions, France and Portugal would achieve comfortable reserve margin levels (13.3% and 13.90%, respectively) while Germany shows the tightest at 8.60%. Please bear in mind that German data differs between research.

However, under severe weather conditions, the UCTE report highlights potential strains in France (average reserve margin of 4.4% with a low of 0.6% anticipated in the first weeks of January) because of the country’s significant exports and in the UK (average reserve margin of 6.4% with a low of 1.7% in the last weeks of December).

In the UK, shut-downs of coal-fired power plants will not be entirely offset by new CCGTs, renewables and new nuclear (which will be brought into service no earlier than 2017). The reserve margin is tight but new nuclear explains the relatively modest forward curve.

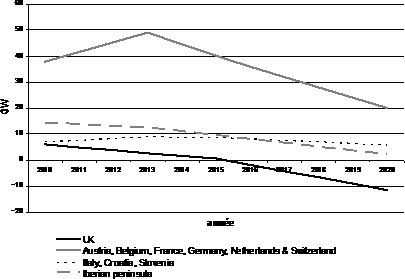
Spain and Portugal look adequate even in severe conditions at reserve margin of 8.5% and 9.10% respectively. However, there looks to be a huge decline in Iberian spare capacity from 12GW in 2010 to around 5GW in 2020 (driven by Endesa and Gas-UNF cuts).

Germany’s adequate capacity depends entirely on nuclear life extensions. However, a likely scenario remains where new plants are delayed significantly, particularly for new entrants. InGermany there is a good chance of losing part of new build from the economic downturn.

Picture2

Just wanted to share some thoughts as I am seeing brokers call a bounce on utilities based on mean reversion and sector rotation. 

Despite being the biggest underperformer YTD, the utilities sector has four mounting problems:

a) €65bn to refinance to 2010
b) €35bn in asset disposals to keep single A rating
c) ROCE keeps sliding after five years of M&A at peak multiples
d) €20bn in capital increases (Enel, Gas Nat, Snam, Vestas, SSE, Centrica…)
Look at the chart attached, because it’s scary. The utilities have been re-rating year on year on commodity exposure, asset valuation increase from M&A and multiple expansion from new technologies (renewables) and at the same time it has become more cyclical, but with very inflexible capex (the sector spends 33% of its market cap every year on capex to deliver 3-4% EPS growth)… while ROCE has been deteriorating steadily (see chart).
On top of this, the sector trades on “growth” multiples (7x EV/EBITDA), but considering the loss of industrial demand and the forward cruve on spark and dark spreads, we could see a continued de-rating of the sector to ex-growth multiples.