Category Archives: Sin categoría
Oil-Gas Spreads Rocketing Again. Careful with the European Gas Majors
Most analysts keep in their numbers for 2012 and 2013 a massive improvement in profitability for those companies that buy long term contracted gas from Russia and Norway. The thesis on ENI, E.On, GDF-Suez and others is simple. These companies have been losing money on their long term contracts due to an agressive take-or-pay obligation. Basically these groups, in a strive to maintain giant market share and profit from their exposure to retail, reached agreements with the major suppliers of gas in conditions that looked very attractive ONLY if gas prices rose and demand continued to soar. As such, major suppliers locked in large take-or-pay contracts with oil-price-linked formulas based on the “conservative” bet that gas demand in Europe would rise by 2-2.3% pa from 2007-2020 and that gas prices would retain their historical link to oil prices.None of those things happened, and greed turned into loss. The accumulation of market share was part of the problem (most of these companies control c60% of market share in their countries), making them very exposed to GDP and demand growth.
… And demand growth vanished. European gas demand peaked in 2007 and is c9% below that level four years later.
The other problem was the bet on oil-gas link remaining, driving spot gas prices higher as demand soared. What happened is that spot gas prices collapsed by 15%, oil prices soared and the long-term contracts were overpriced versus flexible spot levels. This meant losses that reached levels of €1-1.5bn in 2010 for some companies. These losses are expected to turn to profit by 2013 through a combination of re-negotiation of contracts (mainly with Gazprom) and improvement of demand. Errrr…. not likely.
The bet was wrong on both sides (demand and price), and is likely to get worse mid-term, as demand growth estimates in Europe are overstated given the downward GDP revisions. Furthermore, Gazprom and Russia are in active discussions to build a 30BCM per annum pipeline to China, and the Yamal LNG project (where Total and Qatar are likely to be major players) will create a new export route for Russian gas. Therefore, Gazprom’s “urgency” to renegotiate the take-or-pay contracts is diminishing by the day. And their policy is now to preserve wealth (reserves) not to maximize volumes exported to Europe. Gazprom’s decline rates (4% pa, some see 6%) don’t justify a policy of “maximizing volumes at any cost”.
Well, see below a very interesting chart sent by Citigroup updating on the weakening environment for utilities as the oil-gas spread widens.
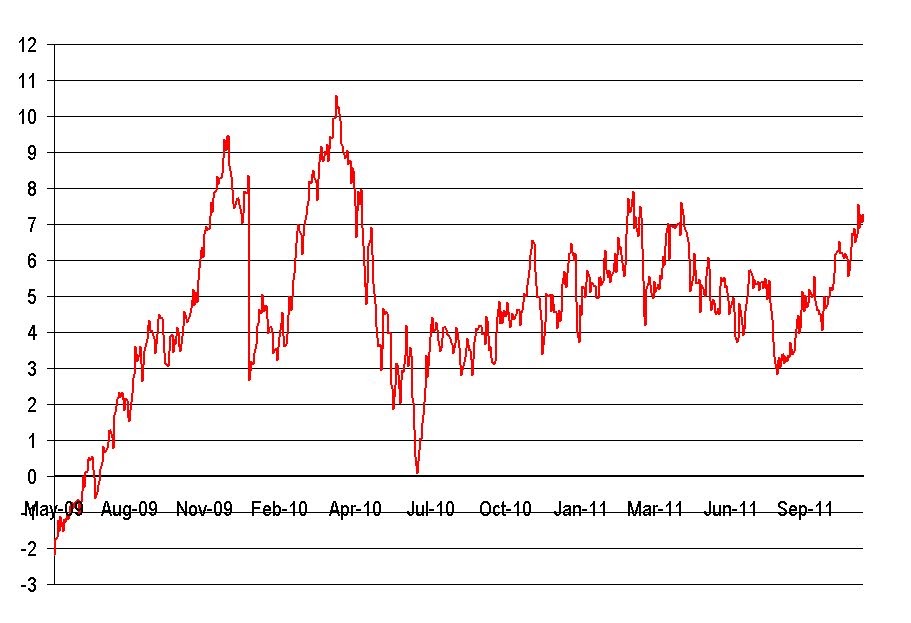
According to Citi “the spread is now back up to €7/MWh as you can see from the attached chart mostly driven from the appreciation of the US$ on which the oil basket that drives long-term gas prices is based. Midstream gas players should now be nearly 100% locked in through October 2012 and ~50% locked in through October 2013 at what they estimate to be a ~€5-5.5/MWh spread. So any incremental volumes sold from now on would actually be at a higher cost given today’s prices, exacerbating loss-making positions”.
The issue, as highlighted above, comes mainly for the giant market-share owners. European demand is unlikely to recover to 2007 levels until 2015, the flexibility of LNG and Asian demand is keeping the gas market in better conditions, but still oversupplied, and the strategic decision of revising take-or-pays goes radically against the political role of these giant companies as “security of supply” providers.
Expect earnings revisions to go…down.
ENI
Consensus expects a return to profitability from demand recovery and re-negotiation of contracts generating an uplift in EBITDA of between €1.5bn and €2bn. However, with Italian gas demand down by 4% in 9M 11 and new gas volumes coming from Libya (16mcm/day, or 1.5bcm in 2012 due to the opening of Greenstream) prices are falling further while ENI may be required to assume some Russian take-or-pay obligations, equivalent to an additional 2 bcm in 2012e, unless we see a favorable outcome from renegotiation with Gazprom on both flexibility and price, something that seems unlikely.
E.ON
Consensus expecting gas midstream business to come back to profit in 2013 with approximately 50/60% contracts renegotiated by end of 2012 Bull case: +€1bn in Ebitda 2012 and +€2bn Ebitda 2013. In a no-renegotiation bear case -€850m in Ebitda 2012 and -€1.7bn in Ebitda 2013
GDF-SUEZ
Concerning GDF-Suez, new negotiations are starting now on contractual clauses (renegotiation every 3 years). Normalization is expected by 2013 with still a wide range in the consensus: (+€1bn – +€2bn) €1bn delta on 2012e Ebitda of Gas division from one broker to another.
Why Italian and Spanish CDS can rise 40%… and Greece is not to blame
(Published in Cotizalia on 5th Nov 2011)The peripheral European sovereign risk premium and the role of CDS (credit default swaps) have focused the debate this week with my Twitter followers. Despite the enormous stimulus measures and bailout packages, the CDS of the peripheral countries remains at historic highs. It falls one day and rises quickly the next. That is because, despite all the stimulus plans, the risk increases.
On the issue of credit default swaps there are many myths that often hide the desire of governments to mask reality. We’re used to hear that every time the premium rises they say that it is because of Greece, the Fed, or any other excuse.
The CDS market is about $ 24.1 billion gross. Insignificant compared with the impact of the ECB and public institutions. The European Union itself in 2010 analyzed the potential impact of CDS positions on the cost of debt and concluded that there was no effect. Nevertheless, the EU has banned CDS without collateral, a cosmetic measure as not even 0.3% of the CDS market transactions are negotiated without coverage.
The main positions in CDS are in Italy ($ 22.8 billion), Germany ($ 13.1), Spain ($ 13.1), Brazil ($10.6) and Greece ($ 8.7), but for those who support the the theory of an “attack from Anglo-Saxon institutions” against Europe, the figures don’t even compare remotely with the U.S. CDS positions, or, more tellingly, General Electric, Bank of America, JPMorgan and Goldman Sachs that, combined, surpass the CDS exposure to Italy and Spain together. The biggest exposure to corporate CDS is … Berkshire Hathaway with $ 4.8 billion, far more than Deutsche Telekom, Telefonica, and France Telecom, all below $ 4.0 billion.
. Those buying CDS do not expect that countries or companies go bankrupt because in that case the “credit event” would make these CDS worthless. What they expect is to cushion the impact of default risk. In fact, when one buys a CDS, one seeks to mitigate the probability of bankruptcy when it is between 20 and 65% (Spain is now at 29%, Italy 35%). From 65% chance of default, the CDS does not protect.
. While Euro governments persist in the mirage metric of debt to GDP, false because what matters is free cash flow generation, bond investors looks at the percentage of income to interest expense, the acceleration of debt and deterioration of the accounts, calculating the difference between the actual cost of it, artificially manipulated by the ECB buying, and the real one if it was traded in the open market, given the fundamentals of the economy and the type of interest that institutions would demand.
By that calculation, unless things change, the Spanish CDS, for example, could rise 40% in the next twelve months (519 basis points if the deficit reaches 12.5% and the financial costs exceed 35% of income). Since it is very likely that the next government sees a real deficit of 8% instead of 6% due to lower income than expected (uncollectible bills of autonomous regions) and see higher non-computed costs, the probability is not small. in Italy, the deterioration of the accounts has made the 10 year government bold yield 6.595%, its highest since 1997. And the deterioration of the accounts is visible while refinancing needs take 20% of all Euro supply. Italian CDS rising by 35-40% is also likely as spending cuts are proving less and less evident.
. 96% of the sovereign CDS market is absorbed by the financial institutions (many semi-state owned) that accumulate billions of European sovereign debt (€275bn) and know they have to “pitch-in” and buy more when countries need to refinance € 5.9 billion from 2011-2015.
. Many of the new CDS are “quant CDS”, a simple long-short strategy in which the investor buys protection against sovereign risk using CDS, buying in dollars and selling in euros, which “insulates” the sovereign risk and covers the two parts with no “speculative” impact to the country risk premium.To understand the rise of risk premium spreads we must analyze the lack of institutional demand, as the demand-supply analysis explains perfectly why the CDS up despite aid packages to Greece, bailouts and injections of debt.
The first major problem for peripheral debt is institutional investors do not demand it because the price and interest does not match the risk .
If we look at official figures, Spanish debt seems well placed between residents and non-residents (62% -38%). The Treasury boasts that 38% of sovereign debt is placed “between non-resident investors”, however this figure conceals the fact that the vast majority are European central banks, which support each other in the orgy of public debt, EU institutions and underwriters. In Italy it’s the same. Institutional demand is all but nonexistent. Very active buyers are the European central banks, government agencies and the Social Security, which can go to the primary market and is filling its reserve fund, up to 80%, with sovereign bonds . In other words, almost 45% of the debt is bought by the issuing country and the rest by the EU entities.
On Thursday’s Spanish auction there was not a single final customer order, I have been told by several banks. The same since July 2011. And in 2012, Spain has €150 billion more to refinance. Italy has €361 billion maturities in 2012. Therefore it is essential to attract capital and to stop placing the debt in a false cocoon market buddied between the ECB, public entities, social security and underwriters. Countries have to show that this investment is attractive for foreign capital. And that can only be achieved regaining confidence in public accounting, commitment to re-pay, providing transparency and allowing the investor to receive an interest on that debt that is right, not manipulated.
The fundamental reason for the rise of the CDS is not the absolute debt level, religiously repeated by politicians, but the acceleration of expenses and the deterioration of cash flow.
The other reason why CDS are not down is the huge refinancing needs. Between 2011 and 2015, European governments must refinance € 5.9 billion and European companies another €1.1 billion, all while GDP and stagnates and spending does not drop substantially. Italy, especially the Czech Republic and Spain are the biggest risks.
It seems normal that bond investors will continue to demand a premium over the German bund of at least 150 basis points rising to 400 if the deterioration of the income statement of Europe SA continues. The sovereign debt risk premium of peripheral countries is at risk of rising in a scenario in which the supply of debt in the market far exceeds the possibilities of investors to buy it. Spain can not expect to reduce their risk premium when their refinancing needs account for 8% of European supply in 2012, because it is simply impossible to bear weight by investors. The same with Italy, which accounts for a staggering 20% of European refinancing requirements in 2012.
Oil Is Cheaper Than Water. Feedback From The Oil Money Conference
(Published in Cotizalia in October)First, excuse the interruption in posting in the past month.
I’ve spent the last weeks busy with the launch of my new fund, The Ecofin Global Oil & Gas Fund, and traveling, visiting some of the most significant discoveries of the last decade, from Moccasin in the Gulf of Mexico to Jubilee in Ghana, through oil shale assets in Texas, and culminating with the most important annual meeting of the global oil industry, theOil & Money Conference . An exceptional event, with the participation of people like the secretary general of OPEC, Abdalla Salem El-Badri, the Saudi Prince Turki Al Faisal, the directors of the largest oil companies, major financial institutions and some investors. If I remember correctly, one of the very few representatives of hedge funds was me.
Well, what I promised to my Twitter followers is debt. Here are the main conclusions of the conference.
The main concern of the producers is demand. Saudi Prince Turki Al Faisal stressed it several times. “We will not increase production of 9.2 million barrels per day to 15 million when demand is well covered by all producing countries . We’re not going to invest billions of dollars to see barrels unsold at the port. ” Still, Saudi Arabia maintains its investment program of $129 billion and the projects that would guarantee that production cushion if needed. I myself have seen the development of the Kursaniyah and Khurais fields and these can produce much more when they want … if they want. I have also seen Ghwar and the much criticised decline is being addressed through new technology and improved recovery.
According to estimates from several industry leaders at the conference, up to 15% of current world oil demand is “credit bubble” driven, that is, generated by low interest rates. If we add to this that much of the industry leaders question the sustainability of demand in China, it is normal that during the meetings there were strong calls for a cut in quotas in OPEC’s next meeting in December. We’ll talk about it here if I’m invited to Vienna this year.
The problem is not the quantity and quality of resources available, but the increasingly onerous demands by producing countries , either excessive regulatory level U.S. and European legal uncertainty or lack of political certainty in others. Christophe de Margerie, CEO of Total, in a brilliant intervention, made it clear. To invest for 30 years $720 billion annually (global capex) the industry must have an environment that will generate adequate returns to capital cost and risk.
Worldwide, De Margeries stressed that today there are over 100 years of demand covered with proven reserves of conventional oil, heavy oil and oil sands.The problem is not of available resources, as evidenced by recent discoveries, 500 million barrels in French Guyana less than a month ago, for example, but that the industry is allowed to generate an adequate return and develop those resources safely and effectively. And there I agree. After twelve years accepting poor returns, and seeing their shares do nothing, it is logical that a ROCE (return on capital employed) of 25% at $ 80/bbl has to be a minimum target when the average cost of capital is nearly 9% and projects last 20-25 years.
One of the most critical areas in the conversations came from the optimistic estimates of demand growth of the IEA. Everyone agrees that these will be difficult to achieve, especially in regard to the return to growth in the OECD, as estimates don’t take into account the de-industrialization and dramatic increases in efficiency, but also in regard to emerging countries. At the end of the day, the projected demand of the agencies is always “diplomatic” and tends to err in excess.
Many participants reiterated that the optimistic estimates of demand, added to some apocalyptic estimates on supply, give a sense of tightness and urgency that the physical market does not see anywhere . After all, OECD inventories are comfortably within historical average. In this sense, many criticized the exaggerated estimates saying that they generate an unnecessary investment bubble. Of course, make no mistake, no one complained that the price of oil was too high. “Doomsday predictions are making a huge favor, and free, to the industry” said a friend.
In this sense, all industry leaders criticized the monetarist policies and inflationary stimulus plans and low interest rates, as the main cause of increased commodity prices (oil has risen less than sugar and rice, for example, in 2011). Jeff Currie of Goldman Sachs noted that the impact of financial positions in the oil price has proven to be imperceptible, and that the price is not a question of lack of supply, because the commodities where there is no shortage or are cultivated have risen as much or more than oil, and reiterated the impoverishment of investment conditions as the great problem of the sector.
One of the most interesting parts was the analysis by geologists on the process of reducing the decline in production from mature fields field by field, with decline reductions of up to 30%. Petrofac is going to implement this in Mexico with Pemex. It’s all about price. With high oil, tertiary recovery is very attractive.
The Secretary of OPEC, Abdullah al-Badri, summed up the situation: OPEC does not seek to “defend” oil prices . The current price is justified by cost inflation added to a shortage of rigs available to rent that reach $ 450,000 a day, and the shortage of qualified personnel. “All the engineers are in hedge funds” a friend of Kuwait Petroleum told me.
The average price where OPEC needs to balance their budgets is an average of $ 75-85/bbl, as the social costs of the countries are increasing and therefore the average price can go up as well.
The 2010-2020 plan of the twelve OPEC countries includes 132 projects, $150 billion investment and 20 million additional barrels a day of production .The spare capacity of OPEC now stands at 5 million barrels a day , which has proven to be an excellent cushion when Libyan exports were interrupted, which is not expected to recover to pre-war level until 2013.
On Iraq, Issam Al-Chalabi, former minister of oil in the country, said that production forecasts have improved thanks to the improvement of some contracts to make the investments more attractive, and thanks to lower cost ($ 6 to $ 11 million per well), but lack of infrastructure and legal structure, as there is still no oil law, will make it difficult to reach 3.8 million barrels per day of production in 2013. Still, Iraq is exporting 2.2 million barrels / day and large projects generate returns of 23-25% (IRR).
I’ll stick with the following conclusions:
1 .- Demand is inflated and probably will not reach 92 million barrels a day if the debt reduction process of the global economic system is carried out, finally. The best thing that the industry has learned over the past 25 years is to avoid flooding the market. Seeing what has happened to other industries, it is logical that the oil industry puts back into the center of their investment decisions a decent return on capital employed, and not capex based on optimistic forecasts on demand.
2 .- Although the world is more complex today than ever and the geopolitical situation can always get worse , the industry is not going to stop investing, as it did in 2007-08 or 96-99. Annual investments to produce 90-95 million barrels per day of production (including unsold surplus capacity) will remain.
3 .- Exploration investment will not increase over the $150 billion annually but industry will intensify the investment in non-conventional oil in the United States, being of low political risk and high profitability. The industry will continue to explore and develop the frontier areas, especially West Africa, where there are no production constraints imposed by OPEC membership, crude oil quality is very high, the wells are under-explored and regulatory and legal conditions are very attractive.
Is oil is expensive? Less than mineral water, platinum or silver. As Europe gathers 65% of the price of gasoline from taxes, and their companies collected $ 6/barrel from refining margins, you know what governments have to do to improve competitiveness . Lower taxes. Blaming the producers who invest $400 billion in developing their resources, is a lot of rhetoric and little reality.
Detailed feedback below:
HRH Prince Turki Al Faisal:
No other country can compete with the Kingdom on proven reserves. If it added unproven, as Iran and Venezuela do, it would still rank #1 in oil resources worldwide.
9.2mmbpd of current production with spare capacity of 2.3mmbpd having 20% of all proven oil reserves.
The Kingdom is pushing projects that will be able to deliver 15mmbpd.
However, Saudi Aramco has no intention to boost production to 15mmbpd because demand is being well supplied by other countries. This target is self imposed, given the billions of dollars spent on increasing capacity to see unsold barrels of oil in the port.
However, Aramco keeps its $129bn capex program still ongoing.
The Kingdom covers 40% of domestic needs through gas and will look at nuclear and other options but costs are not acceptable today.
Saudi Arabia is a picture of health and stability compared to any other country in the region… Even several European ones.
The Kingdom continues to be a leader in the region supporting Bahrain, Oman, Egypt and other countries with twelve packages of $8bn each an another eight aid packages of $4bn each.
Saudi Arabia GDP per capita $23k, higher than any other BRIC country.
Issam Al-Chalabi, former minister of Iraq oil.
Current production 2.7mmbpd and 2.2 exported. Tough to get to 3.8mmbpd and above 3mmbpd exports due to lack of infrastructure. Maximum 5.5mmbpd by 2020.
Lack of proper rehabilitation of existing facilities, putting at risk the reservoirs.
Costs range from $6mm to $11mm per well.
The increase of reserves to 143 bn boe needs more credible proof.
Iraq still without complete government (min defense, interior, etc).
For Kurdish minorities KRG main issue is to legitimize the Kurdistan contracts which are deemed illegal by Iraq. Also look to get recognised the “disputed lands” which is twice as big and oil-rich as the old Kurdistan.
Oil and Gas Law. Six drafts submitted. None approved.
Iraq will be affected by what is happening in Syria as they are supporting Assad.
. Shokri Ghanem, former minister of oil, Libya.
Warehouses, contractor camps, cars, spare parts and facilities have been looted.
Says the war has not ended, and attacks continue.
Says return to production onshore virtually impossible.
Almost 2000 4WD cars needed just to move personnel.
Production: 550kbpd end year, 1mmbpd in June. Pre-war levels at best two years.
Staff unrest at oil fields a big concern.
Also a big concern on whether TNC will re-negotiate all contracts.
Gabrielli (Petrobras CEO)
“The modern world cannot live without oil and gas, and this will not change”.
10x more financial contracts than physical.
Pre-salt $45/bbl breakeven.
Demand down in OECD, up on EM. More efficiency expected.
Climate change targets will likely be abandoned in OECD, and impossible to implement in EM. However, efficiency improvements will continue to bring demand lower than GDP growth.
10-25% of demand to be serviced by biofuels.
More challenging production, not more expensive.
Christophe De Margeries (Total)
“Of course there are plenty of reserves in the world, but it’s harder and harder to access them as countries want to keep them for their own people” “not a question of oil resources but exportable capacity” “there are more and more resources but not available at the same time”
Fossil fuels to represent 76% of energy supply in 2030. After Fukushima gas to become second largest energy source by 2030.
Gas increased by 24% from previous analysis, nuclear down 5%. Solar +17% pa to 2030 and Biofuels +5% pa.
Significant resources yet to be produced:
. 3,000 billion barrels. More than 100 years of demand of oil available including oil shale and heavy oil.
. 2,500 billion barrels of gas. 135 years.
“Fight with contractors is not anymore here. The current framework works”
“Price of oil will have to stay high to justify investments or these will collapse as returns are pretty average”
Libya to full production in 2012
“The oil and gas industry is the most heavily taxed in the world, with up to 80% tax from production country to up to 60% in consumption country”