Category Archives: Sin categoría

Brent-WTI Spread…. More Fundamental than Market Perceives

brent wti
(This article was published in Cotizalia on Feb 17th 2011)

I write to you this week from Oman. Impressive country, producing 900 thousand barrels of oil a day, and 9% of GDP from oil revenues, which finances amazing investments in infrastructure and civil works from Musqat to Salalah and other cities that are downright impressive.

As a country, it’s an example of how different the countries of the area are, despite the Western media efforts to put them all in the same basket of so-called risk of Egyptian contagion.

Another week and now that the Egyptian crisis has been solved, the market continues to focus on that country and the risk involved in the Suez Canal for crude supplies. And there is no real risk. The importance of the Suez Canal for the transportation of crude oil has fallen sharply in recent decades. During the 60s and 70s, almost 10% of global oil traffic passed through the canal. Today, it’s less than 1%. Moreover, as the three largest companies working in the channel say, the traffic is roughly balanced, with 55% of oil on ships heading north (992 thousand barrels/day) and 45% (about 850 thousand barrels/day) due south. Any problem in the Canal is, first, negligible for the transit of oil and, second, very easy to re-route around the Horn of Africa, an increase of transit time of less than 15 days.

For those who care about Egypt and the Sumed pipeline, just remind them that it only moves 1.1 million barrels per day despite having a capacity of 2.4 million barrels per day. And as a good friend of EGPC told me, there are few safer places than this pipeline, where the army has more troops than any city in the country except Cairo.

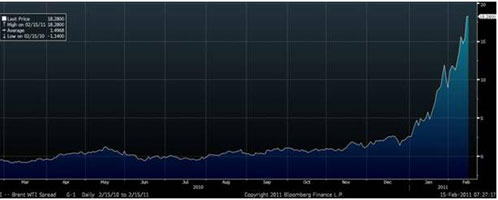
And in this environment we find the Brent and WTI spread at historical highs. Two clear effects: first the inflationary impact on Brent added to the deflationary impact on WTI to create the largest differential between the two ever seen: $14.5/bbl. Also very wide differential relative to other crude, Bonny Light (Nigeria), in particular, and Asian Tapis.

Let’s start by explaining what justifies the weakness of WTI:

Inventories at Cushing (at Oklahoma) are at historically high levels. 50% higher than the average for the past five years (25022). The problem is that the WTI weakness shows the growing isolation of the North American market and infrastructure problems to evacuate excess oil.

WTI crude trades on the basis of inventories at Cushing, in the middle of the American continent, and it is hard to move oil out of the area (called PAD II) or the large refineries on the Gulf.

1) There is enough transport capacity to carry crude from the Gulf to the center of the continent, but not vice versa. The fact that the Enbridge pipeline has had problems has increased the glut of crude in Cushing.

2) There has been an increase in exports of crude oil (oil sands) from Canada to the U.S., which increases the overcapacity in Cushing. Transcanada launched the second phase of its Keystone pipeline, which attracts even more crude to Cushing bottleneck.

3) The increase in U.S. domestic production, including Bakken, is also filling the stores in Cushing. The over-production in the U.S. is partly because the gas companies take advantage of high oil prices to produce more natural gas liquids, whose price is close to oil, in order to fund production of natural gas which today at $4/mmbtu, is not giving the best economics, actually very poor returns. Therefore they compensate for the low profitability of the gas with the price of associated liquids.

Add the fact that three refineries have been closed for maintenance, and we have the perfect storm. Excess production of high oil prices, withdrawal of the American system because of lack of infrastructure, and reduced refinery demand .

Meanwhile, Brent is affected some powerful inflationary forces:

1) The decline of production from Norway and North Sea, that previously functioned as a cushion against price increases, and does not produce that effect anymore.

2) The increase in OPEC oil transit to Asia, and rising domestic demand in exporting countries have reduced the oil for export. Saudi Arabia expects to increase its exports by 1 million barrels per day, but, for now, demand does not justify it.

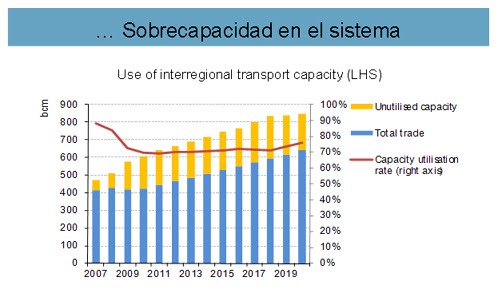
3) The perception of geopolitical risk and the effect that we mentioned of transport cost increase. The market assumes that the cost of transport must rise. We are already seeing freight day rates recover, particularly in the VLCC segment, as I commented with Oman Oil. Having seen the Baltic Dry Index tumble to record lows due to excess spare capacity of ships, we could start to envision a horizon of recovery. Very gradual, and certainly not to be bullish, because overcapacity still exists (especially in the Capesize and Panamax segments.) And if freight costs rise, the chance to evacuate American crude to Europe is reduced.

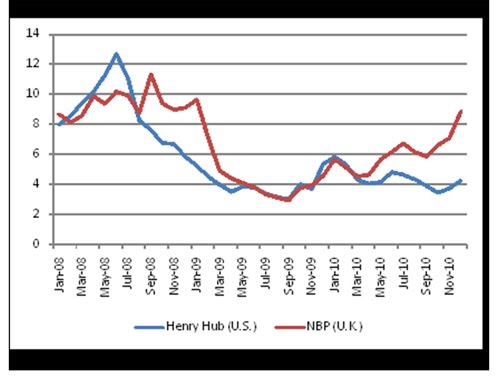
As I mentioned two years ago on the differential between gas (Henry Hub) and oil, it is very dangerous to play against a very clear structural effect of isolation of a market, the American, in which the administration has no intention of promoting improvements in the system, and as a result, crude oil and domestic gas (WTI and Henry Hub) at lows is a clear boost from the country’s competitiveness.

Further read:

http://energyandmoney.blogspot.com/2010/01/revolution-of-shale-gas.html

http://energyandmoney.blogspot.com/2011/06/iea-releasing-strategic-reserves.html

Can Oil and Nat Gas go back to historical parity?


(This article was published in Cotizalia on December 16th)

oil gas sobrecapacidad

We discussed many months ago that the link between the price of natural gas compared to oil broke in mid-2006, reaching a historic high gap in 2010.

Why natural gas and oil have “de-linked”

a) Natural gas is used mainly for power generation and heating. Oil is used primarily for transport. Natural gas demand has suffered from falling electricity demand in the OECD, which has slowed down aggressively between 2007 and 2010, and most countries face problems of overcapacity in generation after the growth of renewables and thermal capacity. Meanwhile, oil demand has remained almost constant between 2007 and 2010.

b) The revolution of U.S. shale gas, which is approaching Europe from Poland, has increased the reserves of gas dramatically (and growing production in the U.S. by 15BCMs per annum despite Henry Hub trading at historic lows, between $4 and 4.5/MMBTU). Meanwhile, oil reserves, which have also grown with the discoveries of recent years, have not increased so dramatically even when in 2010, as was in 2009, we will have a global reserve replacement ratio exceeding 100%.

oil gas curva 2

Of course the anti-oil lobbyists say that there are only 40 or 60 years of oil (depending on whether or not we include NGLs), but the reality is that there’s plenty of oil. Plenty but not necessarily “cheap”, if we assume $40-50/bl as benchmark. Because oil is very cheap indeed. One of the world’s cheapest and most productive liquids. In 1991 when I started in the oil industry people said there were just 20 years of reserves, and now there are 60 (proven). And after the discoveries of Brazil, we will continue to see a very solid replacement ratio. Wait till we see the results in the Arctic, new frontiers, etc …

c) The shale gas revolution and LNG have lowered the marginal cost of natural gas, while in the oil complex, the marginal cost has stayed flat even in the downturn, as the oil complex re-rated due to the increased technical costs and more complicated geologies.

d) Additionally, the price of natural gas has been affected by a very significant increase in liquefaction capacity (more than 15BCM per annum to 2013), while in the oil market supply challenges remain. Oil-on-sea stored in vessels was rapidly consumed in 2010, and despite OPEC claims of almost 5 million barrels a day of spare capacity, the supply-demand balance has tightened.

oil gas curva 1

These fundamental shift in supply and demand fro both commodities has made companies enter a process of renegotiation of oil-linked long-term gas contracts to achieve a higher level of spot indexation, suited to a more cyclical and flexible power demand environment.

The Future

It is worth mentioning the huge difference between prices of liquefied natural gas sold to Europe or Asia. This shows how each gas market is very different and regional. On the other hand, the oil market is global and, despite talks of electric vehicles and other inventions, Asian demand and the traditional use of oil for transport will not vary dramatically.

In the fourth quarter of 2009 the average prices of LNG varied between $4.5/MMBTU (Spain) and $ 7/MMBTU (Korea). But between the second and fourth quarter of 2010, Asian demand and a colder winter have led liquefied natural gas prices to reach levels of $9/MMBTU (Spain, Japan and Korea). In oil, most countries are seeing that the price of crude in local currency remains very attractive, due to the collapse of the dollar, especially for China, whose dollar reserves fall in value every month. That is why demand has not fallen despite the poor economic environment when oil surpassed $90/bl. As the president of OPEC stated, oil is trading closer to $70-75/bl in constant dollars for them.

In summary, it is hard to foresee an environment in the short-term (1-2 years) where the difference between oil and gas will return to historic levels. While LNG capacity expands and shale gas advances, supply will continue to be well above demand. But in the medium term, the horizon is a little more positive.

If there has been something that has been shown in 2010 is that the natural gas market is suffering from less overcapacity than expected. And in the medium term, we can see that uncontracted demand for liquefied natural gas will likely exceed 10BCM in 2013, leaving the market balanced. This does not imply a massive price appreciation given the spare capacity in the system (Russia, Qatar, US-Europe shale), but the market is set to gradually tighten in gas, although at a slower pace than what we have seen in oil. Only a collapse in oil prices from unforeseen excess capacity or a switch in the use of oil for transport to gas could help close the gap.

Anti-climatic Change, and UK Nat Gas

(This article was published in Cotizalia in Spanish on December the 8th)

UK Gas balance

In May 2010, gas inventories in England were at a truly low level, with storage almost empty, at a level of 35%. The country decided not to take the opportunity of having gas prices at a minimum to fill storage for the winter. Why, You may ask yourselves. Two reasons. On one side, a group of scientists who had advised the ministry and the industry that “climate change would create one of the warmest winters of the last hundred years”. On the other, the view that would have “radically hot and dry” winter(The Guardian, July 2010) due to the effect of La Niña.

Additionally, the Uk decided to play “commodity trader”, and clung to the estimates of CERA (Cambridge Research) and Wood Mackenzie about a bubble of gas in Europe from 2010 to late 2012 . According to these estimates, the Qatari government was going to flood Europe with cheap liquefied natural gas, the Russians were going to get nervous and cut prices aggressively, and the Norwegians would have to sell below cost price. Even agreeing that the gas market has spare capacity, and I have written about it several times, is very imprudent to take a bet on prices to fall, not to secure supply, when the price can move dramatically depending of many factors.

Of course, today at 2 degrees below zero, the British gas system is in deficit of between 15 and 25 million cubic meters (see graph). Of course, the “scientists” were wrong by as much as 170% in their projections of climate, and thus gas consumption. Of course, gas producers have not foolishly flooded the market. And nothing happens here, no one said it had been wrong, while England and the continent are desperately trying to buy more gas …. 41% more expensive than three months ago.

UK Gas vs Henry Hub

In Europe we have spent more than a year complaining about the oil-linked formula of long term gas contracts with Gazprom and Statoil. Of course, when gas has decoupled aggressively from oil, as gas demand growth has slowed down dramatically, we have seen governments and E.On-Ruhrgas, GDF-Suez ENI and others force the machine to renegotiate their contracts with major gas producers. Perfectly acceptable.

Anecdotally, I remember the CEO of Gazprom say in London that for eight years, when long-term oil-linked gas contracts were very competitive compared to spot gas, no one complained. And he said if it was not possible to renegotiate the contracts but with retroactive effect, ie, all they had lost between 2002 and 2008 subtracted from what buyers have lost between 2009 and 2010.

Well, now that they have renegotiated up to 20% of contracted volumes to be linked to the price of spot gas… Surprise. The spot price ($8.8/MMBTU) exceeds the long term, compared with the price of Gazprom ($7.8/MMBTU) and Statoil ($7.5/MMBTU). These things happen. And of course, solar and wind energy can not cover the difference in consumption, and the bill of the average consumers in the UK, for example, will rise by 20% when it would have only risen 9% if the measures had been taken to ensure supply and maintain the reserves filled in summer with gas prices 41% lower.

Of course, they forgot that the gas market is also global and is one of the most rapidly adjusted given supply is focused in very few countries. And the liquefied gas, LNG, and especially the spot part, which is still less than 12% of total gas, is sent to that market that pays the highest. Asia, in this case. So again, companies and politicians, instead of worrying about security of supply and proper planning, decided to play the market. A lesson to be learned by all European countries.

The Independent states that despite the low temperatures and having been a 346% wrong in their estimates of 2002 about the melting of the Arctic, global warming is a looming problem that will cause one million deaths in 2030. With this track-record of successes, I can not help but tremble.

Africa, The Most Promising Frontier Area for Oil

AfricaConference_FINALCall_for_papers

(This article was published in Spanish in Cotizalia on Thursday 2nd December 2010)

The oil world is preparing for a new capex super-cycle. In the past 14 years I hadn’t seen a building activity in rigs and seismic vessels as significant as this one. As the world seeks to reduce investment and reduce debt, the oil industry is expected to increase 15% its capex in E&P. And as for new equipment built, it might not reach the 1982 peak, but it’s getting close.

The oil world post-Macondo not only has not slowed down in activity, but every day we see more companies increase its drilling capacity. Three reasons:

a) The oil companies can not develop the recent discoveries fast enough.

b) The industry has finally realized that the era of cheap oil prices is over and we can not continue planning at $25/bbl.

c) Tightness in deep water rigs and equipment has increased as companies seek to accelerate the development of discovery in Brazil … and Africa.

The event that many companies expected (prices to come down and oil service costs plummeting after the moratorium in the Gulf of Mexico) has not occurred. And it has not happened because not only Petrobras is almost monopolizing the market by placing orders for oil rigs at breakneck speed to meet its development program in deepwater fields, but because independent companies are doing absolutely outstanding discoveries in Africa.

Africa overall has about 10% of proven reserves in the world. Not much. But new discoveries have increased the possibilities to advance in the basin of Guinea-Sierra Leone-Liberia-Ivory Coast and Madagascar, and Mozambique-Tanzania-Kenya, which is estimated to be as productive as Tupi in Brazil. There are three factors that differentiate Africa from other areas of the world:

a) Crude oil of very high quality.

b) Geological areas relatively close to the water and ports (so no need to build huge pipelines and infrastructure).

c) Oil outside the influence of OPEC (ex_Nigeria and Angola, of course).

d) Very favourable economic and administrative conditions.

Even the most sceptical would agree that the negative naysayers have had to reduce the estimated cost of development in areas like Uganda and Ghana and expand the reserve estimates (Wood Mac Kenzie has been a clear case of erring on the side of caution in their estimates). And this has been proven, as always, by the independents.

Both in Uganda and Sierra Leone, Liberia, Tanzania and Mozambique, independent explorers have shown that not only the accumulation of hydrocarbons was much higher than originally estimated, but the capacity and speed of development of these discoveries is better than initially expected. Over the past five years, the discoveries in Africa are proving to be of really attractive quality and strength.

Now, once that independents have tested these areas, the big oil companies are re-launching the African region programs with total investments estimated at over $150 billion in the next three years. From Kenya, which was almost forgotten by the industry, to Mozambique, including Madagascar, the geological structure is already estimated, by many companies as AFREN, to be very similar to Tupi in Brazil. In meetings with exploration companies since 2004 I have been following these discoveries and today I can say that all expectations have been exceeded, so the sceptics should at least give them the benefit of the doubt or to take a breath.

Anadarko’s CEO, Al Walker, estimates more than 1 billion barrels of oil equivalent in their recent discoveries in Africa. And BG just discovered the equivalent of 2 billion cubic feet of gas reserves in Tanzania.

Since 2001 there have been more than 15 billion barrels of oil equivalent discovered in non-OPEC Africa, and 2 billion of those barrels only in 2010. In 2015 it is expected that 20% of world production will come from Africa (ex-Nigeria). Cheap oil, of high quality, free of restrictions from OPEC and with lower administrative and political problems. No wonder that the U.S. considers Africa (ex-OPEP) as a strategic frontier in the war over natural resources.

Update:

Ophir provided higher-than-expected gas resources in Jodari in Tanzania (3.4tcf vs pre-drill estimate of 2.2tcf) de-risking concerns about the pace of gas discoveries needed for an LNG development.