The Fed´s More Than Questionable Legacy

@dlacalle_IA

Yesterday, Janet Yellen, Chairman of the Federal Reserve, announced an increase in interest rates of 25bps, the second time in a decade, and expecting three more rate hikes in 2017. At a continued rate of +25 bps per year, it will take the US nearly 10 more years to get back to a 3% Fed funds rate.

Let us remember what was promised to support the massive stimulus plan:

The White House predicted an average growth in the economy of 4-4.5 percent, unemployment would drop to 5 percent, and the budget deficit would shrink to a mere 3.5 percent of GDP.

During the Obama administration and the massive expansionary poilicies of three QEs and ultra-low rates, economic growth was a mere average of 1.4%, 2.1% if we exclude 2009. That compares to an average 3.5% with Reagan, 3.9% with Clinton and 2.1% with Bush Jr (average annual GDP growth).

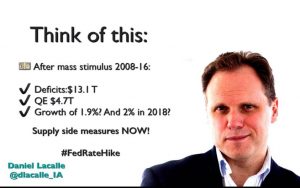
The recovery growth gap compared to other recoveries since 196o has been set at $1.67 trillion. That means the weakest recovery in recent history, as well as an economic growth that has stalled at almost half of the promise. Average The Federal Reserve expects 1.9% growth for 2016 going to 2% in 2018, the weakest relative to potential and previous recoveries.

All of this is after a massive $4.7 trillion monetary stimulus and $10 trillion in new debt (a fiscal deficit increase of $13 trillion at State, local and Federal level). Public debt ballooned from 48% to 75% of GDP. Average annual deficit was 5.2% and for 2016 it is expected to be 3.2%.

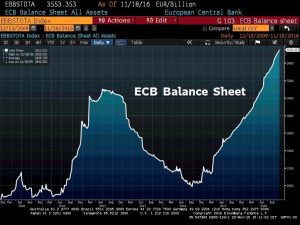
Quantitative easing was launched under four premises. Provide liquidity to reduce the risk of contagion after the financial crisis, add jobs, inflation and growth.

Its first objective was clear and worked. Unfortunately it went from solving a problem of liquidity to creating the largest bubble in financial history. High yield bonds at the lowest interest rate seen in 35 years, and stocks at all-time highs, exceeding fundamental valuations and real earnings growth.

But job creation was a success. Was it not?. 4.6% unemployment! 9.3 million jobs created. Being good, and to deny it is ridiculous, employment figures are far from what is expected of the world´s leading economy after a $ 24.7 trillion fiscal and monetary stimulus. Under Reagan 12.6 million jobs were created. Under Clinton, 21 million. Even with the massive crisis, Bush Jr saw 5.7 million in job creation.

On the one hand, more than 11 million people are out of the labor force, leaving the labour participation rate at 1978 levels, and it is completely false to say that it is explained by demographics. The US has a similar demographics as the UK and labor force participation is almost ten points lower. In addition, labour force participation rate has fallen in almost all segments of age (very important between 25 and 54 years).

In October 2016 425,000 workers left the labour force, the highest level of the historical series, reaching a total of 94.6 million working age Americans that are not participating in the system or looking for a job. That shows a labour participation rate of 62.8%, not seen since 1978. In addition, the number of US citizens who supplement their income with food stamps has doubled from 20 million to more than 40.

Temporary employment stands at 18.2% (less than 35 hours per week), ie considered recessionary levels. In times of growth, the US has always had a 16.6% lower temporary rate. In the recession of 2001 it was 17% and in 2008 the maximum was 20%. With the biggest stimulus in history, it has only been reduced slightly to 18.2% even with the aforementioned poor labour participation.

Since 2009, doubling the debt, the average household income in the US has fallen in all segments (the median of $ 55,000 to $ 54,000 and the poorest segment from $ 13,000 to $ 12,000) and real wages continue to be at 2008 levels.

To top it all, in the last five years, the US annual productivity growth has been 0.6% on average, the poorest since 1978.

Inflation expectations have also been consistenly revised down throughout the period. In fact inflation expectations have only come down until the recent uptick in October, and still stand below the 2.8%-3%.

What is more interesting is that QE has been disinflationary as money velocity has collapsed and capacity utilization remains poor, at 75%. The massive creation of money has gone to create huge inflation in financial assets and disinflation in the real economy, laying the grounds for one of the most dramatic imbalances between asset classes and industry and consumption seen since the 70s.

The argument against all this is that “it would have been worse” and that the crisis was too big. None of them work, and sound more like excuses as other presidents lived through deep crises as well. But those excuses don´t stack up against the fact that the US created more than half of all the money supply in its history in the past eight years and has seen the longest period with ultra-low rates.

In summary, the Federal Reserve´s policy has generated results that range from disappointing -liquidity- to complete failure -jobs, growth and inflation- but leaves behind a massive bubble in financial assets that will not be easily sorted. Raising rates so slowly only perpetuates the bubble.

No wonder Americans have decided to vote for Trump´s promised supply side policies.


Daniel Lacalle is a PhD in Economics and author of Life In The Financial Markets and The Energy World Is Flat (Wiley)

OPEC-non OPEC deal. US shale wins

@dlacalle_IA

Over the weekend OPEC and non-OPEC countries delivered the first coalition cut pledge in 15 years with 11 non-OPEC countries agreeing to cut output by 0.56 mbpd. This is on top of the pledge from OPEC to lower output by 1.2mbpd as well.

Russia 300k, Mexico 100k, Oman 40k, Kazakhstan 20k, Azerbaijan 35k the bulk of the cuts.

One of the big problems of this agreement is the alternative of the devil. That by which a decision is likely to have negative or very negative consequences.

The main beneficiary will be the shale in the US, immediately taking the opportunity to increase volumes. US rigcount surged 27 units to 624 on the week ending on the 9th december, up 220 since May 27 and the biggest increase since 2014.

Additionally, the image of producers acting to harm consumers will accelerate substitution -electric vehicles, efficiency measures- from importers.

Then there is the issue of compliance.

OPEC has a notorious history of non compliance with supply cuts. Members tend to cheat on quotas and, as prices rise, volumes pick up again.

But let´s remember that this “deal” comes after OPEC increased production from 30mbpd to 33.6mbpd. That is, it´s a deal to cut just a part of the increase, to 32.5mbpd.

I have been invited four times the annual meeting of OPEC in Vienna and I have seen many myths spread by the media. Let us remember for a moment why OPEC agreements do not happen easily.

  • OPEC is only 30% of global production of crude oil and liquids. Their ability to influence is declining in a global market where additional barrels come from countries where production decisions are not state orders, but business decisions of thousands of private companies -Canada, US, North Sea-.
  • OPEC countries do not value their position based on price, but on market share. For that reason, Iran or Iraq are unwilling to reduce their production until they respectively reach pre-sanctions and pre-war market share.
  • OPEC countries do not provide hard quotas. Therefore, decisions to reduce production are always left to the discretion of each country, which tends to exceed its production limit.
  • Freezing production knowing that the substitution will come -at least partially- from US barrels has zero impact on the market balance, but has a very important negative effect on producers’ image with customers.

Let us remember that the most “optimistic” see a market balance in 2H2017 after this cut pledge, so there is a strong risk that it may not happen at all.

Even after these cuts -if they happen-, oversupply in the market exceeds 500kbpd and spare capacity is higher than 2.6mbpd. Meanwhile, the IEA has revised up estimates of US production by c500kbpd. It could go as high as 1mbpd in less than a year.

Dallas Federal Reserve President Robert Kaplan estimates that US oil production has potential to top 11mbpd in less than two years and most market participants, including the IEA, see a very likely short-term increase increase to 9mbpd from current 8.6mbpd. Continental Resources CEO Harold Ramm goes as far as to say that US shale producers could increase output to 20mbpd.

This oversupply is also evident in the huge amount of oil stored on ships, already at the same levels of 2008, about eight million barrels.


OPEC will only succeed if demand strengthens and oil producers make it clear that they are much more flexible and competitive than other alternatives. If they fall into the trap of a pointless cut, substitution and technology will accelerate the process of stripping oil of its crown as king of primary energy sources.


Daniel Lacalle is an economist and author of “Life In The Financial Markets” and “The Energy World Is Flat” (Wiley)

This article was originally published in Spanish by @elespanol

Kick the Can Further. Draghi’s Dangerous Bet

@dlacalle_IA


Why be shy when you can kick the can and shout ” Sean O’Hagan

When Mario Draghi, the president of the European Central Bank (ECB), analyzed the eurozone’s macroeconomic and monetary data on Thursday, he confirmed a very fragile environment and disappointing figures. However, the stock markets reacted on the upside. Why?

The results

The European economy will grow by 1.7% in 2016 and 2017 and 1.6% in 2018 and 2019. Despite flooding the system with liquidity, expectations have not increased. And, in fact, the risks remains “on the down side” according to Draghi himself.

In terms of monetary aggregates, the increase in M3 fell to 4.4% annualized compared to a growth of 5.5% in September. Loans to the non-financial sectors grew a meager 2%. Remember that all this is happening with the greatest monetary stimulus seen in the history of the euro.

What about inflation? It increased from 0.4% in September to 0.6%. But it is fundamentally because of the cost of energy. Draghi himself recalled that “there are no convincing signs of recovery of underlying inflation” – that which excludes energy and food-.

The velocity of money (nominal GDP / M2) – which measures economic activity – is at multi-year lows and more liquidity and low rates does not help improve it. QE is disinflationary for prices because it sinks interest margins of banks by artificially lowering bond yields and makes economic agents behave with more caution – not rush to spend or to borrow – due to the perception that the cost and quantity of money is artificial. But it is very inflationary in financial assets.

What these figures tell us is that growth is still very poor and the huge amount of monetary stimulus created from the Central Bank does not have the effect that its defenders promised. The European Central Bank’s balance sheet has soared to 3.58 trillion euros, more than 400 billion euros above its 2012 high, and the accumulation of risks is more than evident, even if many decide to ignore them.

The risks

Since the repurchase program was launched in 2015, the excess liquidity accumulated in the system has soared to more than one trillion euros.

The euro-zone has more than 4.2 trillion euros in bonds with zero or negative rates, according to Bloomberg.

The ‘inflation’ that we are told does not exist, lies in the huge bubble of bonds and ultra-low bond yields. This accumulation of risk is exactly as dangerous as that of 2006-2008 but potentially more difficult to contain, since economic agents are not in a better position of solvency and repayment capacity today than in that period, particularly governments, which are much more indebted. This leads to ineficient and heavily indebted governments falling into the trap of thinking that cheap money will always exist and decide to increase their imbalances, entering into a debt shock when rates rise.

If EU countires get used to ultra-low rates the risk of multibillion nominal and real losses in bond portfolios and pension funds is enormous, because the tiniest tilt in inflation will make the house of cards collapse. Goldman estimates losses of $2.5 trillion worldwide from a 1% rise in inflation. It is so relevant that if interest rates raised a stunted 1% in the EU it would lead to massive budget cuts to maintain current deficits.

Of course, Draghi does not stop repeating, and he did it again on Thursday, that this period of excessive liquidity must serve to correct imbalances and implement structural reforms. But no one seems to listen. Cheap money calls for cheap action. More “fiscal stimulus” and more spending.

Draghi, knowing that almost no eurozone economy could absorb the rate hikes and increased risk if the repurchase program ended in March 2017, as it was announced, decided on Thursday to extend it until December although “reducing” the pace of purchases. That is, kick the can forward and an optical reduction because tapering from 80 to 60 billion per month is irrelevant when excess liquidity in the system has soared from about $ 125 billion to $ 1 trillion in the QE program period.

With this measure, Draghi seeks to achieve two things: That governments reconsider their positions and put structural measures in place without creating a serious liquidity problem. On the other hand, to help the yield curve reflect a slight rise that helps banks out of the hole  in which they are with negative interest rates.

The problem is that the structural challenges of the European economy -demography and overcapacity- are not solved by perpetuating imbalances because governments and economic agents simply get used to seemingly temporary measures as if they were eternal.

The perception of excess savings is incorrect in heavily indebted and overcapacity-ridden economies. There is talk of excess savings with respect to investment because the 2001-2007 period of excess spending and debt bubble is used as “normal”. And the central bank floods the market with liquidity thinking that investment will increase if rates fall. As if such drop in rates was “demanded” by the market. But investment is still stagnant with zero rates. Because there is no demand for solvent credit and there is spare capacity after years and years of industrial plans and excesses.

Risk assets jumped on the evidence that such excess liquidity will continue to inflate the bond bubble and hopefully support other financial assets. And in December 2017, if the monetary laughing gas ends, governments will blame Draghi, or Merkel, and not the inaction of a European Union happy to continue with interventionist and anti-growth policies.

And no, most European states are not prepared for the end of QE. They are geared to its extension.

Daniel Lacalle has a PhD in Economics and is author of “Life In The Financial Markets” and “The Energy World Is Flat” (Wiley)

This article was originally published in Spanish by @elespanol