(This article was published in The Wall Street Journal on June 26th, 2012 copyright WSJ)
The recent pullback in Spanish bond yields has been heralded locally as almost a victory. But if so, it’s probably a pyrrhic victory, as Spain’s 10-year sovereign bond yield still stands at 6.5%, and five-year credit default swaps remain at historic highs of 563 basis points. Meanwhile, the question in investors’ minds is the same: How will Spain repay its public debts, which have more than doubled since early 2008 to 72% of GDP as of the first quarter of 2012?
Before Spaniards elected the Rajoy government last year, the previous government had denied the crisis for years and failed to act swiftly upon it, leading foreign investors to avoid the country’s bonds. Spanish public debt owned by non-residents has fallen to 37.3% today from 54.5% in 2010. The real figure is even lower, as a significant portion of that 37.3% represents debt bought by the European Central Bank.
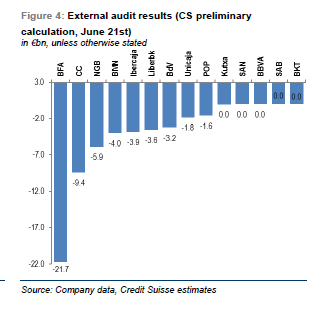
The slump in international demand has been mostly offset by bond buying by domestic institutions, including the Spanish social-security and public-pension funds, and mostly from Spanish banks. These Spanish banks now loading up on sovereign bonds are the same ones that have used €288 billion of the ECB’s discount-lending facility so far this year. This is a truly dangerous move, as the vicious circle of risk-contagion between bank balance sheets and sovereign risk affects every asset class. This has also created a credit crunch for the real economy, particularly unhelpful in a country in which small and medium-sized businesses generate 70% of value added and almost 80% of employment.
According to Spanish Finance Minister Luis de Guindos, investors are not taking Spain’s “growth potential” into account. There is truth in that assessment, but Spanish authorities seem resigned to the notion that they can do no more to actualize this “potential.” I believe there is a lot more they could do.Given its potential, Spain can do better, it can do more and it can do it now.
Spain has failed to restore investor confidence in its ability to repay its debts predominantly because the reforms pushed by the Rajoy government so far have focused mostly on revenues, namely tax increases, while the government’s bloated administration and massive subsidy culture remain in place. As such, the economy deteriorates and taxes go up, while debt continues to grow.
Spain seems stubbornly intent on restoring tax revenues that were the product of a giant real-estate bubble, and those will not return easily. Tax collections per capita increased almost 40% between 2003 and 2008 due to the housing bubble, driving a similar increase in government spending. Spain created a public sector perfectly suited for an economy that would grow 2% per year forever. It didn’t. Once the bubble burst, those revenues disappeared but the spending stayed. That funding gap, which took Spain to an 8.9% deficit in 2011 from a 2% surplus in 2007, can not be tackled through taxes, but only through cuts in spending.
When discussing possible cuts to Spanish public spending, one always hears that every reduction is only a drop in the ocean. True, but a million “drops” would add up quickly in a country with 17 regional administrations, thousands of loss-making public enterprises, tens of billions in subsidies, and a complex web of regional and national regulatory bodies.
The Spanish economy, centered on services, industry, tourism and construction, is strongly cyclical. As such, the burden of the state and the maximum debt it can sustain need to be smaller than its less cyclical peers. Spain could restore confidence and reduce its bond yields by achieving this through a four-step, zero-cost program focused on:
1. Structural public-administration reforms: Eliminating duplicative public administrations, chiefly in regional, island and county councils, could save up to €20 billion, according to Spain’s Circle of Entrepreneurs think-tank and the Conservative Party. Additionally, selling off Spain’s dozens of public television and radio networks, and ridding taxpayers of thousands of loss-making companies owned by regional governments, could save €10 billion.
2. Tax Reform: Increasing Spain’s standard value-added tax rate to 20% from 18%, while reducing the employer portion of social-security taxes by 3.5 percentage points, could boost GDP by between 1-1.3% without any decrease in government revenue, according to a recent study by domestic banks. Spain scores 69.1 out of 100 in the Heritage Foundation’s Index of Economic Freedom, significantly below its peers. It needs a long-term sustainable plan of tax incentives for new businesses, and a unified system of regulation instead of the current patchwork of rules, to allow small and medium-sized businesses to grow into large corporations.
3. Cut subsidies by half: Spain spends more than 2% of its GDP per year on corporate subsidies and grants (not including its aid to banks). So far these have only been lightly trimmed throughout the crisis. The subsidy culture keeps zombie businesses in place and puts up a barrier to the development of more productive enterprises. End it.
4. Attract capital: Spain’s private-equity funding of companies is below 0.1% of GDP, according to the national stock-exchange regulator. This is partly due to regulatory instability, along with its protectionist regulation of foreign capital, as any fund that has tried to open an office there knows. By opening its doors to foreign investment, Spain could erase the view that all major deals there must happen between friends and behind closed doors, thus improving its public image in financial markets.
Sovereign-bond investors are by definition the most risk-averse of the world’s financiers. Markets want clarity, sustainability and no surprises. Spain needs to prove to them that it can not only meet its current economic estimates, but beat them. The country has done it many times in the past, and it still possesses all that “potential” that Mr. de Guindos talked about. Spain can do better, it can do more and it can do it now.copyright The Wall Street Journal. Published with permission.