Category Archives: Sin categoría

Oil Prices Reaching Breaking Point For The Economy?

I just came back from a trip to New York and investors concerns about energy and oil prices were clearly at the top of the agenda.

Who’s to blame for the current oil price?. Supply? demand?. Mmmm. I have a feeling that the blame this time is on Mr Draghi and friends in UK, Norway, Australia, US, with the ongoing mass liquidity injections and QEs, all driven to generate inflation one way or another, and driving investors to increase net length in crude.
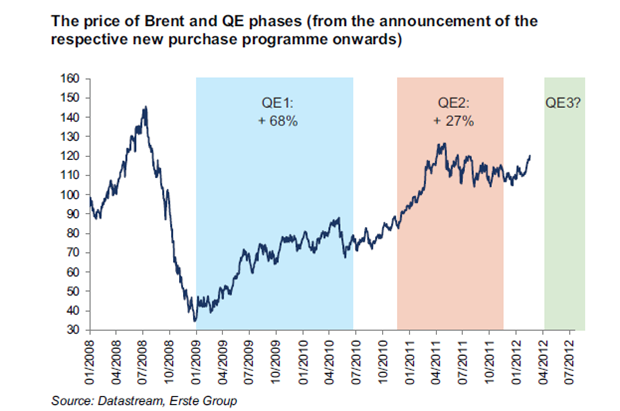
OIL QE

Oil prices reached all-time high in Euro and in GBP last week. All US media is mentioning high gasoline prices and it’s a permanent fixture in Europe news. If sustained, the price increase since December could trim 0.25-0.5% from annualized real GDP growth over the next year. Moreover, the combination of a stronger world economy, massive liquidity injections and quantitative easing programs with increased tensions in the Middle East suggest that a bigger shock is less of an issue than in the past.

Barclays highlights that “it is not necessarily the oil price itself that can pose a threat to economic growth but the pace of its growth that is more important. It is the sudden surge in oil prices that leads to an abrupt shock to consumer spending and economic growth. Consumer durable spending, the most sensitive component of spending, fell sharply when the 3-month annualised change in headline inflation exceeded 9%. In each case, the price of oil rallied in excess of 40% over a 3-month period. In contrast, the latest geopolitical fears have, so far, led to a 20% rally in oil” …and inflation is way below 9%, at 3-5%.
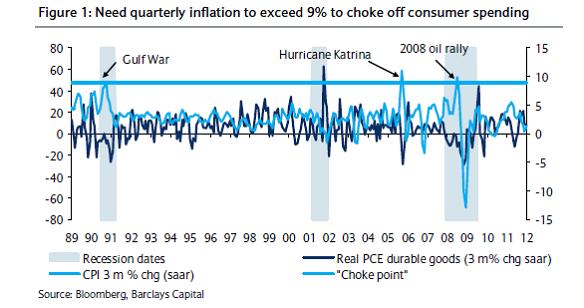
quarterly inflation

Let’s start with supply. Global oil supply, despite Iran, Syria and Lybia is at record levels. Not only Russia and other producers are keeping the pace strongly, but OPEC is producing at all time high, as per the figure below:
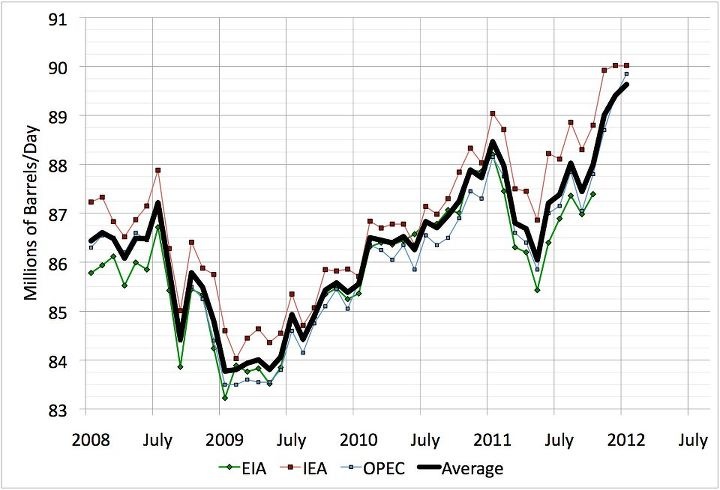
photo opec

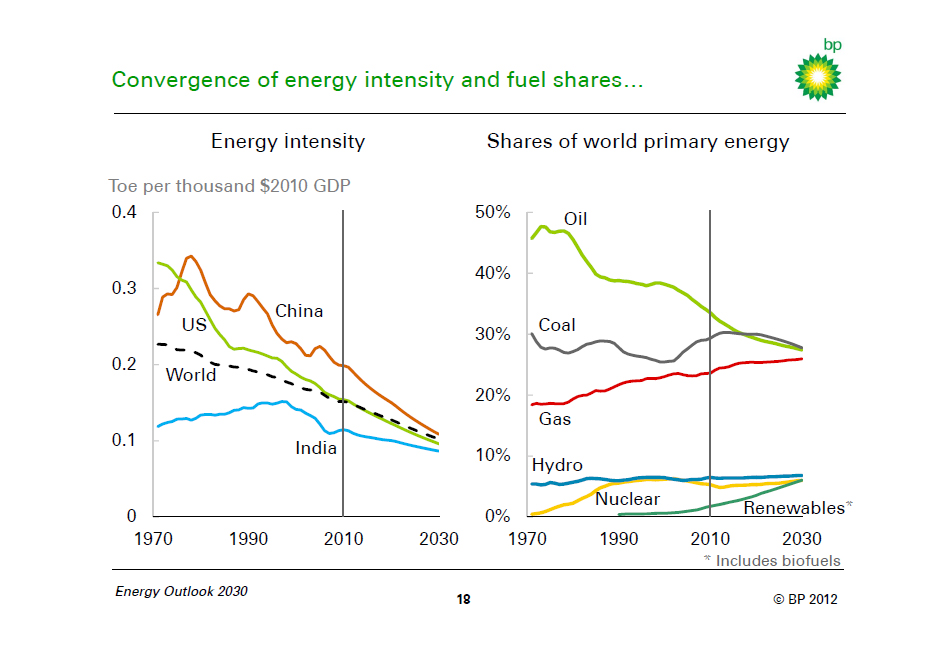
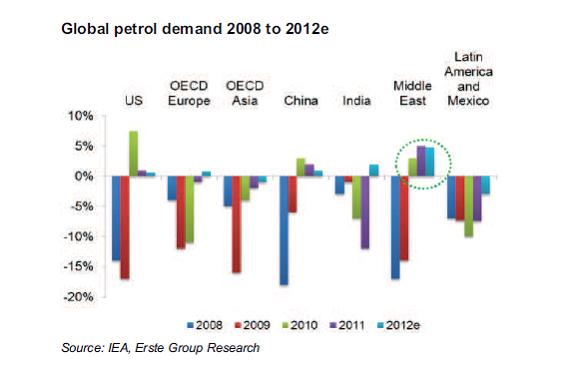
What is interesting is that, outside of the Euro crisis, the world’s economies are behaving much more strongly than expected but oil demand is not reacting. Efficiency comes to the fore. What many call “weak demand due to crisis” is in many cases, US being the clearest, a relentless improvement of efficiency. See below:
photo
Additionally, the US imports reached a 12 year low last year thanks to the shale oil and gas revolution we have mentioned many times in this blog. The US imported 8.91m barrels a day of crude oil last year, according to the US Energy Information Administration, the lowest amount since 2000. US and Europe implied demand is down between 5 and 7% yoy, while Asian demand is pretty much unchanged. Emerging markets are keeping global oil demand above the 87mmbpd, but every two weeks we read from the IEA or other agencies that they are lowering their demand estimates for 2012. The IEA said it expects oil consumption to rise a relatively poor 800,000 barrels a day, or 0.9%, in 2012, according to its latest monthly market report. That would be 300,000 barrels a day less than the IEA forecast just a month ago. As we said at the beginning of the year, I expect demand to be flat year on year.
Inventories at the OECD have been shrinking recently, but remain within the average band of the last five years, 57-60 days of demand covered. The market is tight but not excessively tight, as prove by the fact that demand is well covered despite geopolitical disruptions in Iran, Siria and Nigeria.
CFTC Non-Commercial long/short net positions (21st February)
CFTC MANAGED MONEY net positions (21st February)
ICE Brent long/short net positions            (14th February)
Crude
228,180 (prev 204,752)
215,802 (prev 202,222)
Non-Commercial
105,901 (prev 93,673)
Nat Gas
 -124,929 (prev  -126,157)
 -70,832 (prev   -72,314)
Managed Money
96,703 (prev 88,706)
Gasoline
90,298 (prev 87,696)
91,640 (prev 88,575)
Heat Oil
27,566 (prev 23,544)
43,207 (prev 39,379)


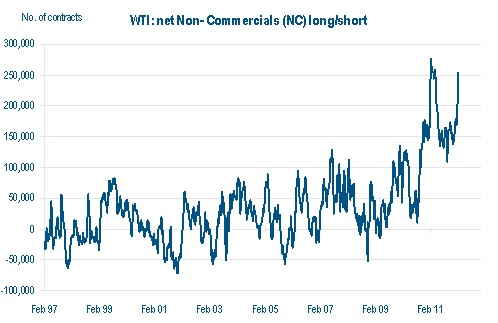
One of the areas that interests me the most is the growing net long interest in crude, reaching levels close to 2008. The inflation trade is on and the carry trade is guaranteed by the insane monetary policy and low interest rates “for the foreseeable future”.
cftc february

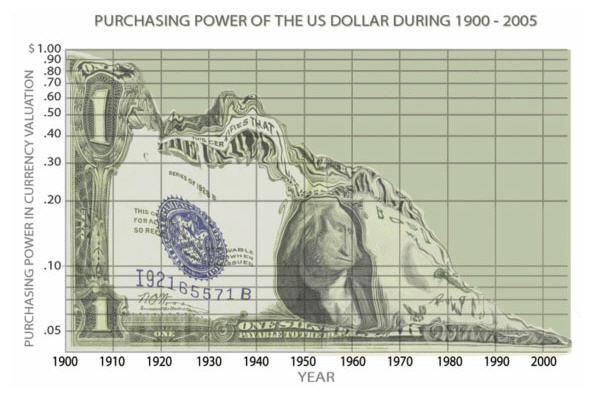
Think about it. Monetary supply is growing so fast, from China to Europe, because the developed world is worried about deflation, that we cause inflation in all commodities (except regional and local ones like US natural gas). The balance sheet of the ECB has multiplied by 3 since June. Monetary supply is twice as high as it was at the end of the past decade.
dollar weakeningAccording to seeking alpha (see link here): “Developing China’s M2 money supply has been rising by a large 20% and Russia’s by a very large 30%.Even developed countries such as Switzerland have seen money supply growth of 25%. Japan’s M2 is gradually moving higher after the ‘Lost Decade’ and after recent events exacerbating an already fragile situation. Global money supply growth is increasing by 8%-9% per annum”.
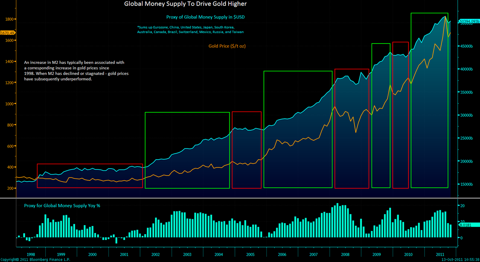
money supply

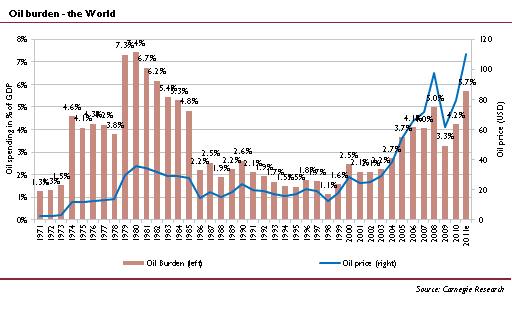
Then we go to the issue of “the oil burden” or the import bill versus GDP. It’s  currently close to 5%, but the share of the oil burden in the OECD is diminishing, making high oil prices less risky for the recovery. Meanwhile, in emerging markets, high oil prices are also a less of a problem as the oil consumption generates products, goods and services of much higher productivity and higher added value. Remember that most emerging economies do not “need” low oil prices, that is more an OECD construct. Those economies have lived with high energy prices for a long time. When the oil burden reaches 7% is when we can start to worry. So far, demand destruction is a concern but not a worry.
photo
Obviously, many of those emerging economies are also oil producers. Russia, Brazil, OPEC, West Africa and Asia are main beneficiaries of a wealth re-distribution out of US-Europe and into new markets.
OIL DEMAND
Brent-Urals has gone negative this week. In this environment, the trade is likely to be negative European refiners. Another trade starting to look attractive is long WTI short Brent as the tensions with Iran are played out and inventory issues at Cushing start to be solved. I do not expect the differential between Brent and WTI to go to zero, but closer to $10/bbl, which is more fundamental, as we mentioned in this blog here (http://energyandmoney.blogspot.com/2011/02/brent-wti-spread-more-fundamental-than.html).
Finally the other attractive trade that seems to be unwinding is a short European Big Oil after the companies showed no meaningful free cash flow generation at the 4Q results and poor refining and downstream margins added to sub-par production growth and upstream profitability. The sector is at the top of its trading range versus the market and the traditional strengths (balance sheet, dividend, safety) are still there but at much more demanding multiples. At 9.5xPE the sector trades at historical high EV/IC/ROIC/WACC. All above 1 (which means expensive).
Meanwhile the US is seeing the benefit of shale oil and shale gas in every part of its economy. Just a small calculation shows that the effect of WTI at $20/bbl below brent and Henry Hub gas at $2.5/mmbtu versus $8/mmbtu in Europe has the same effect as Bernanke’s trillion QE… annually. Read this. In Europe we continue to ban it. Someone in Washington must be laughing hard. The US refiners seem in the best place to take advantage of a strengthening economy and lower feedstock. So do the US oil names. As for US gas names, careful when asset (land) value collides with low earnings multiples, because M&A comes back…. except in joint-venture filled companies, because JVs are giant poison pills.
I believe the risk of demand destruction remains, but unlike 2008, the risk of a financial meltdown and a credit crunch is much lower, and in fact if there is any risk is that loose monetary policy will remain for the foreseeable future, keeping the commodity-led inflation high. Draghi, Bernanke and friends want the carry trade, and need it to avoid deflation in a japanese way. Supply and demand remain well covered, printing money is the wild card.

The IEA March report left 2012 oil demand forecasts unchanged, but highlighted OPEC’s ability to increase production, with OPEC volumes at the highest level since October 2008. OPEC supply in February was 1.3Mbpd ahead of the forecast call on OPEC for 1Q.
OECD inventories rose 13.6Mbbls in January and fell 26Mbbls less than usual in Feb. Furthermore, the IEA sees 625kbpd extra OPEC capacity by 3Q, adding to current spare capacity at 2.75Mbpd (Bernstein).

Data courtesy: Carnegie, Erste, Oriel, BP, BarCap, Bernstein and own research.

Here is my interview on CNBC:

http://video.cnbc.com/gallery/?video=3000076989

Worth a read:

http://energyandmoney.blogspot.com/2012/03/energy-disinflation-as-source-of.html#
http://seekingalpha.com/article/299410-global-money-supply-and-currency-debasement-driving-gold-higher

http://www.thenational.ae/thenationalconversation/industry-insights/energy/flawed-views-on-peak-oil-rear-their-ugly-heads-again

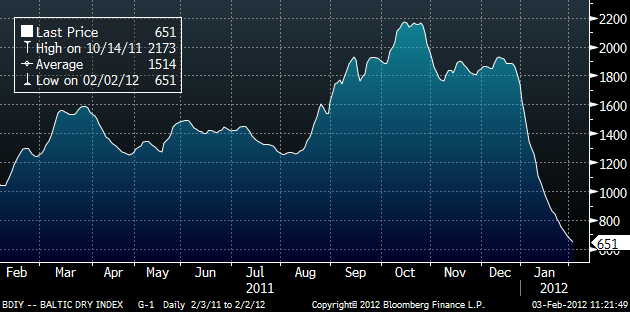
Baltic Dry Index down 65% YTD. The single clearest indicator of the global overcapacity problem.

Baltic 2012
The Baltic Dry Index is down 65% this year and at the lows of 1986.
Main reasons:
a) Oversupply of vessels. While supply has increased an average of 12% pa 2008-2012, demand has been weakening -3% pa.
b) Weaker demand from China, added to high levels of stockpiles all over the OECD, with lower iron ore demand after strong inventory build in December. Inventories stand at 5 year highs. Just the outlook of dire demand from aluminium smelters is a big worrying factor. Despite the cuts in capacity of Alcoa and Norsk Hydro, the outlook for aluminium production is weakening for 2012-2013.
c) Weather issues in Australia driving lower vessel utilization (coal supply disruptions).
d) Commerce trends weakening from LatAm to Europe (-7%) and Asia to Europe (-6%) at the same time as new building of houses, offices and infrastructure is slowing down all over the OECD as a result of the overcapacity created by the stimulus packages (mostly devoted to construction) of 2007-2010.
The Baltic Dry Index neeeds to reflect the weakening outlook for metals demand, with Chinese steel demand growing by 4% in 2012 from 10.5% in 2011 and significantly below GDP growth of 8.4%.
In addition, the delay of the 90mtpa Siere Sul iron ore project for 2016 (from 2014) adversely affects the shipping outlook.
However, brokers still expect c6.5% growth of seaborne bulk commodity supply in 2012-13, driven by 9%+ growth for iron ore and c7% for thermal coal.
On vessel overcapacity, consensus expect the fleet to grow by 13.5% in 2012 and c6% in 2013, suggesting that the shipping market will start to tighten ONLY towards the end of 2013 IF demand picks up.

Rates for Capesize have dropped below $6k and the Panamax spot at $6.5k/day can barely cover operating expenses. Rates are below cash break-even for the largest part of the sailing fleet, and China seems very happy about it, as they drive most of the excess supply and benefit at an aggregate level as a lower cost.

Going forward, we will likely see a small “dead cat bounce” on the Baltic Dry Index once we see the unwinding of the China inventory build that happened pre-New Year holiday and once we see an improvement in weather conditions in Australia, but the underlying deep problem, overcapacity in vessels and massive unused and unusable infrastructure and construction, remains. The fleet is built for a growth that is unsustainable and unreal. The world’s iron ore consumption is not going to grow 12% pa to offset the overcapacity. I believe the small uptick, unfortunately, will be used by some vessel owners to take out some capacity (not enough) and maybe raise marginal day rates, still nowhere close to 2007 levels.

Is CO2 dead?. Down 47% YTD, and Durban will do nothing for it

It’s the end of CO2 as we know it. And we said it here months ago. It was a fake commodity and a manipulated one by the way. The EU accounts for 16% of the CO2 emissions of the world but bears 100% of the cost. By manipulating demand and supply the EU forced up prices to €30/mt, and the scheme seemed to work nicely until the rules of demand and supply deflated the artificially created price. Of course the beginning was to assume an industrial and power demand growth that was wildly optimistic, but the most important part was that the EU issued emission permits and carbon-offsetting credits as if there was no tomorrow. No wonder that expensive carbon and widespread EUA grants have killed what seemed like a nice little niche of indirect tax to the economy. Unfortunately, it didn’t work.

Prices of CO2 emissions (EUAs) have slumped 47% ytd driven by oversupply and the Europe crisis, driving debt-ridden countries to dump their excess of EUAs in the market at any price as we mentioned here (http://energyandmoney.blogspot.com/2011/06/co2-collapses-20-in-two-days.html)

A record 1.5 billion tons of EU carbon permits were traded on the ICE Futures Europe exchange between July and September even as the price slump cut the value of the transactions. Trade in UN carbon credits was a record 348 million tons in the same period. Why? Permit holders are rushing to monetize their EUAs on the fear that the system will collapse under a recessionary environment where the EU will issue even more permits for countries while industrial demand and GDP fall.

And as carbon collapses, all those projects that were sanctioned globally, from CCS to other carbon neutralizing projects, are rushing to monetize before the scheme becomes barely economical. In fact, according to our estimates c56% of those projects will be loss-making at €7/mt CO2 price.

At the bottom of this disaster of CO2 permits lies the planning of the EU, which assumed that every country would follow suit and decide unilaterally to kill their competitiveness and increase the cost of its goods and services. It didn’t happen.

UBS says the European Union’s emissions trading scheme has cost the continent’s consumers $287 billion for “almost zero impact” on cutting carbon emissions, and has warned that the EU’s carbon pricing market is on the verge of a crash next year. In a recent report, UBS said that had the €210bn ($287bn) the European ETS had cost consumers been used in a targeted approach to replace the EU’s dirtiest power plants, emissions could have been reduced by 43% “instead of almost zero impact on the back of emissions trading” (courtesy http://indefenceofliberty.org).

Now the climate summit in Durban is going to put the last nail in the coffin of CO2 and the “green EU” over-subsidized and uncompetitive scheme. In the middle of a recession it is virtually impossible to see the US, which is seeing its economy thrive out of recession partially thanks to shale oil and gas, or China, which is seeing GDP growth weaken by the quarter, take anything but moderate measures to curb emissions. But entering a crazy scheme of CO2 pricing like the EU has done? No.

The Durban conference ran overtime throughout the weekend. The two most important outcomes were agreements to:

1. Extend Kyoto Protocol for 5 years from 2013 to 2017 after its first commitment period expires at the end of next year (but without Russian, Canada, Japan);

2. Reach a legally binding deal by 2015 to cut greenhouse-gas emissions, covering all major emitters including the US, China and India. This is the first time all major emitters have agreed to negotiate legally-binding emission cuts. The deal, however, is to be implemented by 2020. And there are NO penalties involved. So if a country doesn’t comply the deficit is passed to the next period.

Details for both of these agreements still need to be fleshed out, and a working group for reaching a 2015 legally binding deal should commence in the first half of 2012. The main result is that China, US and India have agreed in principal to sign a legally binding agreement to meet emissions targets from 2020 onwards. Until then, all emissions reductions remain voluntary. And by then… we will see. The deal looks to me worth the paper it is written on.

Canada has given notice at the Climate Change talks in Durban that it intends to withdrawal from the Kyoto protocol however it will work towards reaching new emissions targets. Canada’s PM said “to hit targets (the country) would have to take every single car off the road or else shut down every hospital and factory”.  Canada may save as much as $14 billion as a result of not having to buy offset credits starting in 2015 when Kyoto becomes legally enforceable. This is the first of 191 signatories to the Kyoto Protocol to annul its emissions reduction obligation.

This week Goldman Sachs published a note on CO2, “Carbon: Political and fundamental upside risks outweigh downside”. Goldman expects a policy intervention to support prices but agrees with me that fundamentals of supply and demand are atrocious. Not easy or feasible to see aggressive policy to support CO2 prices from dying when Europe has to deal with more pressing issues. An upcoming recession, massive austerity packages, and a monstrous debt burden that needs to be sorted out.

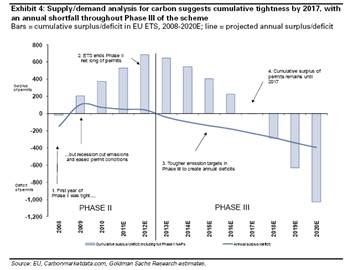
Despite the collapse of CO2 the immediate risks are:- Risk that carbon prices remain depressed due to weak economy and selling pressure as new permits are auctioned. A balance in the supply-demand is not expected until 2017. This could put CO2 easily at €3/mt before it even rebounds, and that is if (and only if) demand for power generation recovers above 2007 levels in Europe, something I do not see happening easily.

co2 chart 1

– Not even political intervention will help. Two amendments to the structure of Phase III are currently discussed:

  1. The first is the option to remove or “set aside” a number of permits from the system (restricting supply).
  2. The second is to increase the 2020 target by reducing the cap (consistent with a step up in the EU’s emissions reduction target from the current 20%). Shortage would still only happen if Europe has been able to recover the path to growth, and even then it would happen at best in 2017.
– What if the EU simply kills the Cap and Trade scheme and introduces of a carbon price floor? . The UK floor was set at £16/tonne in 2013 (€19), more than double current market price. This would effectively bust the scheme, making the new permits worthless and accelerating the sell-off between 2012 and 2014, particularly as the redemption would not be guaranteed by any solvent entity.

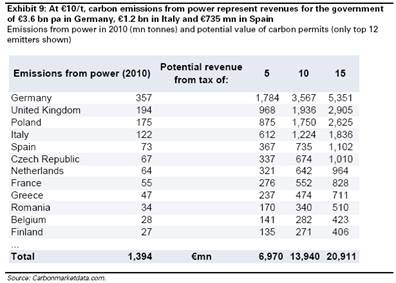
These interventions could be explained by budget deficits and government need for money. Sure, only a problem. GDP and competitiveness collapses and EU loses even further in industrial demand. From 2000 to 2010 CO2 impact on GDP in the Eurozone has meant an annual loss of GDP of 0.5% net of the fiscal profit of CO2 in taxes. Even more, in Spain and countries where the cost of CO2 has been internalized by companies, it has meant a loss of competitiveness of c10% (2004-2010).

Here are the effect of carbon permits:

co2 chart 3

In summary, the mistake of creating a  Cap and Trade scheme instead of a straightforward carbon tax has made the EUAs collapse as oversupply first, and the likelihood of the zero value of the permits of carbon-offsetting projects second have proven that the Cap part was based on ridiculous assumptions of industrial demand. And now there is oversupply already from permits that are issued (let alone the new ones to come) until 2017. Then there is the Trade part, which created a Boom and Bust cycle that is impossible to unwind now that financial investors, companies with free permits and projects are all on fire-sale. And if the EU was going to buy the excess credits… at what price would it do it?  with what money with all countries struggling with debt? who takes the counterparty risk?. I still think we see CO2 get to €3-5/mt. The world need a new framework that is still growth friendly and allows companies to respond with more certainty and stability, carbon pricing is inefficient, ineffective and hopefully on the way out.

Update:

The Euro Council, Parliament and Commission on Energy Efficiency discussions were meant to begin on March 26th but have been pushed back to Apr 11th as countries were not ready to start talks. Chairman of the environment committee says issue of a CO2 floor will certainly not be resolved this year.

OPEC Meeting Ahead: Concerns About Oversupply?

(December 2nd 2011)The December OPEC meeting in Vienna is coming and the picture of the oil market is mixed at best:

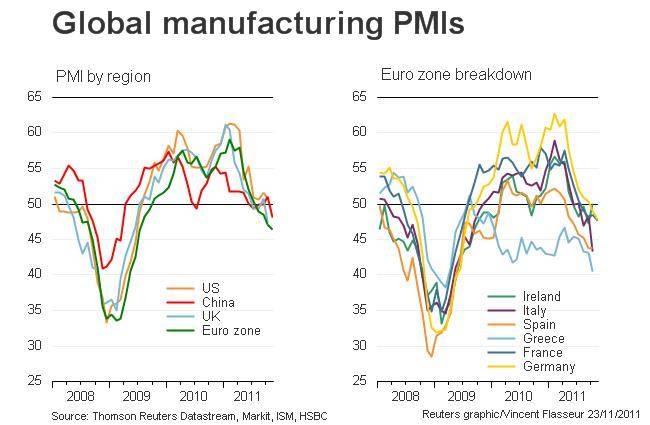
1) China PMI below 50 for the first time since Feb 2009. Global manufacturing PMIs remain weak as the table below shows, particularly in Europe.
2) Bearish US DOE weekly with high inventory build and very low implied demand. The EIA’s monthly revised oil demand numbers for September came in at 18.8m bpd, which was down from 19.05m bpd. It was also down 0.7m bpd y-o-y.
3) OPEC production in November: came in at 30.35m bpd, up 390,000 bpd from October, according to Bloomberg. The increase was led by Libya (155k bpd), Saudi Arabia (65k bpd) and Iraq (50 k bpd).

pmi global

Earlier this month we had additional evidence that the slowdown in activity is seriously reaching emerging markets now. India’s industrial output declined 5.1% y/y in October, the first decline since June 2009, with a 6.0% y/y fall in manufacturing, and with capital goods output down 25.5% y/y.

In the meantime, geopolitical concerns surrounding Syria and Iran, added to the inflationary pressures of the constant reduction of interest rates in Europe and Australia more recently, have kept oil prices at a very strong level, with Brent at $109.6 at the close of this post.

To me, one of the most interesting trends is that heavy oil continues to re-rate and that Tapis (Asia) remains at a healthy premium to Brent, proving that Asian demand remains solid despite the relative weakening in the recent data.

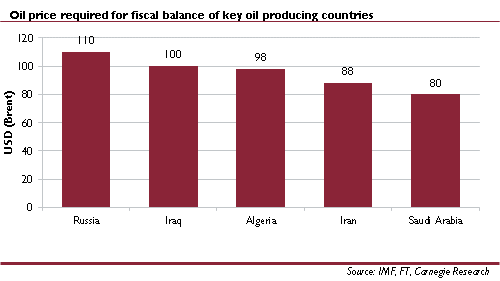
In this environment, another interesting trend is shown by the significant increase in the break-even price required by producers to balance their budget. At $80/bbl, Saudi Arabia’s commitments to invest in social peace and support the MENA stability is starting to prove costly. But still very comfortable versus the market price. Otherwise, Russia’s $110/bbl is a reflection of the strong investment commitments of the country, which are likely to slow down in the next years, so the headline number of break-even price might be overstated in the mid-term.

Break_even_oil_price

Considering this, it is not hard to understand why the OPEC World Outlook Reference Case oil price assumption has been increased from last year. It is assumed that, in nominal terms, prices stay in the range of $85–95/b for this decade, compared to $75–85/b in last year’s expectation.

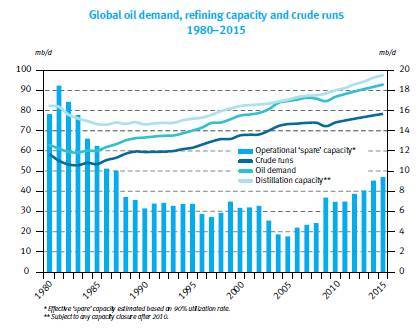
At the same time, global refining capacity is soaring and excess capacity is likely to reach 10mmbpd. This will have a significant impact on refining margins and, as such, high oil prices might be cushioned for the final price paid by the consumer by lower refining margins.

OPEC Refining Capacity

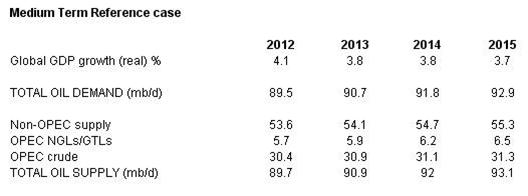
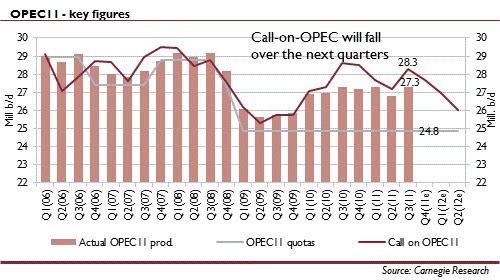
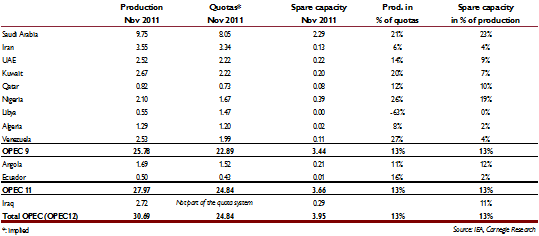
While Russian production stays afloat at 10.3mbpd and OPEC supply stands firmly above 30mmbpd (remember OPEC quotas are 24mmbpd) I continue to think that demand growth estimates are exaggerated, and not consistent with a slowdown in global GDP growth, so until I see a strengthening of the two main demand centers, China and US, I fail to see how emerging markets will offset the decline in OECD demand to reach a total of 92mmbpd demand in 2014. I think we stay pretty much flat at 88mmbpd for a few years.  Worth analyzing Chinese implied oil demand. In November it was 9.5 mm bpd, but this excludes inventory adjustments which are not published, driven by strong diesel demand which comes from regional shortages as a result of refinery maintenance and turnarounds. Crude imports were 5.52 mm bopd, +8.5% y/y but starting to show a slowdown from previous years.

OPEC supply demand

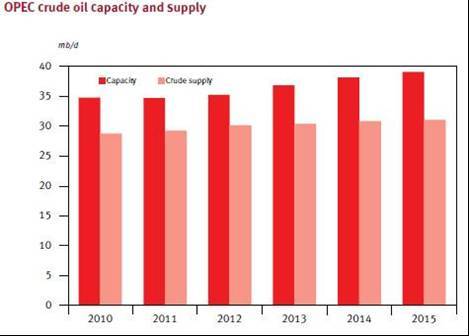
In this context, even if we assume that oil demand rises to 92mmbpd, spare OPEC crude oil capacity is set to reach around 8 mb/d over the medium-term, and in the high case of demand around 4 mmbpd in 2011. Even if I assume no OPEC production growth, spare capacity at OPEC countries is unlikely to go below 3mmbpd, which according to my estimates is pretty much a super-tight market.

OPEC capex spend

Obviously, the big question mark in this picture is how will capex be affected by any weakness in oil prices.

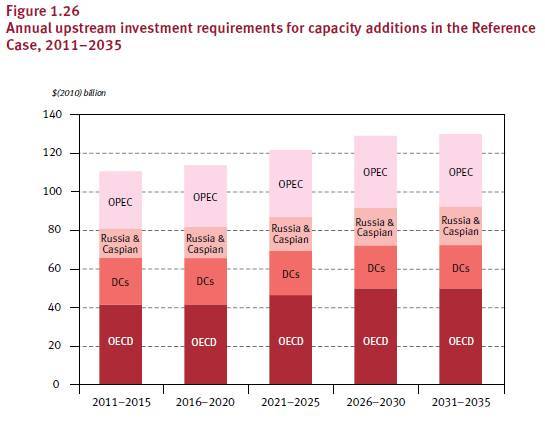
The table below shows the OPEC annual upstream capex required to reach the capacity additions assumed in their base case. Interestingly, this annual capex is unlikely to be affected by a global downturn in the case it happens given it’s such a small proportion of the total global capex including downstream and midstream. So prices would have to dramatically fall below the $80/bbl level to curtail the spending.

So spending is not the issue. The issue is execution and a stable framework that allows this capacity to be added on time and on budget. This is much more difficult than spending and drilling.OPEC Capex Spend II

I think it is safe to assume that we will likely be negatively surprised by capacity additions in the system, probably assuming that around 75% of that capacity is actually added as expected. This, in any case, doesn’t impact the base case of OPEC spare capacity moving between 4 and 8mmbpd in the next five years.

So what is the OPEC meeting going to approve?. Very unlikely to see a production cut given the very high oil prices, even with pressure from Venezuela and acting president Iran to do so. It is more likely that OPEC alerts to a risk of oversupply mid-term, tries to enforce the current quotas, as every country is producing above quotas except Saudi Arabia, and extends the decision to cut or to take action on quotas to a meeting where they can assess the true impact of the Euro and debt crisis on global demand. OPEC could offer an increase in quotas that sets the limit at the current level, so basically making no impact to global supply, just recognizing the real volumes. The risk is that countries will continue to “cheat” on the new quotas, but geo-political concerns might prevent that from impacting prices.
opec quotas

Iran’s role as president of OPEC here is critical, in the middle of the aggressive rhetoric with Israel. If Iran is perceived as anti-West in its proposals to OPEC the moderate side, led by Saudi Arabia, are likely to continue to act as buffers of the oil market. If Iran leads the meeting in a conciliatory and open way, the conclusions will likely be more firmly implemented. The last OPEC meeting gave the impression of countries “against” each other in some instances. This one could be the opportunity for a constructive approach that sends a positive message to consumers and producers alike.

OPEC_production