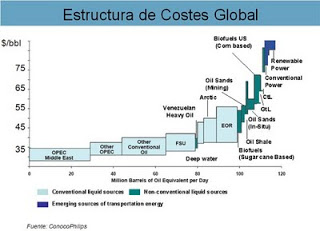
(Global Cost Structure in $/bbl chart above).
“We are not going to run out of oil any time in my lifetime or yours. The resource base is enormous and can support current and future demand” Rex Tillerson, Exxon CEO.
 At this point there are still people who defend the thesis that warns about the risk of declining oil reserves as a massive threat to the world. Each time oil prices rise $5/bbl we hear and read a lot from the peak oil community and the blame on the previous price rise focuses on hedge funds.
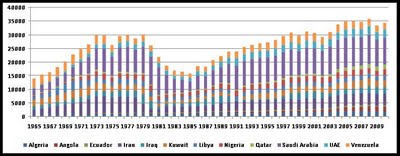
. Only 14 of the 54 countries that produce oil in the world have been able to maintain production since 2004. But most of those have done so due to geopolitical issues, OPEC quotas or conflicts, not because of geological issues. Also, 60% of world oil production declines from 1.5 to 2.5% annually, but global investments between $720 and $750 billion a year in oil and gas have also seen an unprecedented discovery and addition rate. Once investments increased between 2008 and 2011, unsurprisingly, reserve replacement dramatically improved. It’s a question of money and investment, and the industry had been investing below depreciation for too many years.. OPEC quotas explain a large part of the world’s production evolution: OPEC has kept an average of 25mmbpd of production quota since 1999, with only moderate changes to adapt to price hikes. Despite the quota system, OPEC has consistently produced above it (30mmbpd now) but we must not forget that the quota system allows for a “cheat” buffer, preventing countries from exceeding much more than 20% cheat on targets. One of the mistakes of peak oil defenders is to forget that OPEC is a cartel aiming to provide a “steady income to producers and a fair return on capital for those investing in the petroleum industry” (OPEC mission) and to assume that the oil industry is an NGO that needs to “prove” growth to consumers at any price or return.
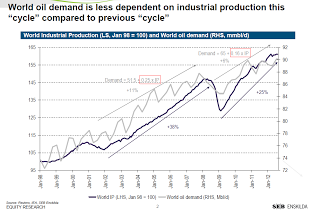
“Crude oil production tends to be pro-cyclical. Because in both Opec and non-Opec nations oil companies tend to be state owned/controlled enterprises, they often operate outside of the standard supply/demand curve. Many have an annual dollar revenue budget. It means that when oil price goes lower, they pump more to meet their budget – driving prices lower. When prices go higher, they have no incentive to pump more and tend to stick to their quota, constraining supply and driving prices higher. With oil price lower in the second half of this year, it is therefore not surprising that production is above Opec quotas. ” (Sober Look)
. Domestic consumption in producing countries increases by 8% average annually, so the net exportable capacity decreases, this is true, but at the same time demand in the OECD is also weakening due to efficiency (estimated by Nextera at 3.5% pa), alternative energy sources and technology. Read my other articles on Chinese demand (http://energyandmoney.blogspot.com/2011/06/china-slows-down-as-saudi-arabia.html).
. Oil production will fall abruptly and unexpectedly. But production is still rising (read here). The fact is that the world could produce 90-92 mmbpd today, if it wanted. It’s not a geological issue, as De Margeries (Total) or Tillerson (Exxon) say over and over, it’s just a geopolitical issue. Oil production stands capped currently only by the Iran embargo, Iraq and OPEC quotas. And still, with Saudi volumes rising, demand is covered more than adequately. Furthermore, non-conventional oil is rapidly taking over, and shale will be a significant game-changer, just as shale gas was. Yes, reserves decline, but reserve additions have made 2009-2012 reach +100% reserve replacement ratio and, even if we decide to question the OPEC data, global production has never been an issue. Supply continues to be more than adequate and demand has never been left unsatisfied. Read my post “Oil Is Cheaper Than Water” for more details.
Out of the “330 projects to change the world” report that Goldman Sachs analysed, I would highlight this part:
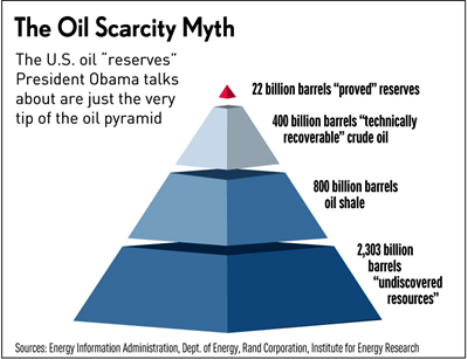 There are more than 125 projects only in OPEC that will be adding between 3.8 to 6mmbpd to supply short term (*) that are just waiting to go on execution pipeline after receiving FID (final investment decision). The constraint is not projects, but project execution and human resources (engineers and capex) to develop them. 3 trillion barrels of conventional resources in the ground and 1 trillion of unconventional according to the US geological survey. That is more 4x more than what population has consumed in all the industrial era.
. Demand only goes up and up. Remember that IEA and EIA demand estimates are diplomatic. Based on GDP estimates of the countries themselves. Demand will adjust, and it’s already happening all over the OECD, due to efficiency and displacement (nat gas, alternatives). Additionally, the notion that Chinese demand will only rise over and over has to be taken carefully. Chinese demand is dictated by the government, up and down. Hong Kong already consumes more oil per capita than the EU. The major cities in China already consume 15-20 barrels per day per capita.
This year’s World Energy Outlook shows that by 2035, we can achieve energy savings equivalent to nearly a fifth of global demand in 2010 (IEA)
Efficiency has been critical in the past years, driving an unprecedented reduction in the needs of energy consumption to deliver the same industrial and economic output. In fact global output has increased by 2% pa with flat energy consumption since 2005.
 Efficiency in Europe is very evident. UBS believe power demand will decline by almost 10% to 2020. Weak economy and deindustrialization only explain a tiny small part of it. The real game changer is ENERGY EFFICIENCY which has just become a legally binding EU target. By 2020 UBS estimate that power consumption in Europe will roughly go back to 2000 levels, basically wiping away 20 years of growth. To quote the IEA:
World Energy Outlook-2012 presents the results of an Efficient World Scenario, which shows what energy efficiency improvements can be achieved simply by adopting measures that are justified in economic terms. Greater efforts on energy efficiency would cut the growth in global energy demand by half. Global oil demand would peak before 2020 and be almost 13 mb/d lower by 2035, a reduction equal to the current production of Russia and Norway combined. The accrued resources would facilitate a gradual reorientation of the global economy, boosting cumulative economic output to 2035 by $18 trillion, with the biggest gains in India, China, the United States and Europe.
. It is a theory propagated by “speculators” to raise the price. I love this because it seems that nobody understands that financial actors are delighted to go short in an overpriced asset (see short positions in natural gas futures, CO2 or coal, for example). Moreover, according to the American regulator CFTC net long positions in oil today are at the same levels as in 2005.
Because the world is full of “corpses” of investors who bought blind at $140/bbl.
“There is no reason to consider there is a risk of sufficient supply,” “I don’t see major concerns as far as the production of oil and gas is concerned.”Middle East is “part of the world where we could be producing much more, but we cannot.” Christophe De Margerie, Total CEO.
At the end of the day I stopped discussing peak oil with defenders because like all conspiracy theories it is mostly based on distorted data, faith, myth and half truths, many times promoted by interesting and well-informed people but mostly by self-appointed “bathrobe home experts” that have never been in an oil field or in the industry, yet criticise Daniel Yergin, author of some of the best literature and analysis on oil (read “There Will Be Oil” here). When data is provided it is deemed “a lie” either from OPEC or from evil oil companies. Or even funnier, non-conventional and liquids are neglected as “not valid”.
Anyway, here we are years later and the world is at record production, even The Guardian admits they were wrong on peak oil , the US is on its way to becoming energy independent and we still talk unicorns and conspiracies.
(*) OPEC’s currently accounted 158 projects aim to add 21.3mmbpd by 2030.
My CNBC interview here:
http://video.cnbc.com/gallery/?video=3000076989
Exxon CEO interview here
Bloomberg article here:
Business week on peak oil:
Why is Obama Lying About US Oil Reserves?http://oilprice.com/Energy/Crude-Oil/Why-is-Obama-Lying-About-US-Oil-Reserves.html
Robin Mills on peak oil:
Further read:
Peak Oil discussion with a defender:
http://energyandmoney.blogspot.co.uk/2012/03/more-on-peak-oil-another-valid-opinion.html
The myths of EROEI:
http://energyandmoney.blogspot.com/2011/06/peak-oil-defenders-most-overlooked-myth.html
Shale oil 600 years of cheap supply:
http://energyandmoney.blogspot.com/2010/11/shale-oil-600-years-of-supply.html
Others:
http://energyandmoney.blogspot.com/2011/06/iea-releasing-strategic-reserves.html
http://energyandmoney.blogspot.com/2011/02/brent-wti-spread-more-fundamental-than.html
On shale gas:
http://energyandmoney.blogspot.com/2010/01/revolution-of-shale-gas.html
Shale gas in Europe:
http://energyandmoney.blogspot.co.uk/2011/06/shale-gas-in-europe-poland-and-energy.html
China shale gas: the new frontier
http://energyandmoney.blogspot.co.uk/2012/03/china-shale-gas-new-frontier.html
And another:
http://www.pittsburghlive.com/x/pittsburghtrib/business/columnists/markowitz/s_747056.html
I agree that there is no shortage of hydrocarbons. I do have the following questions:
1) What sort of worldwide aggregate EROEI do you see in both conventional and unconventional oil over the next 20 years?
2) What do you expect oil, and a distillate like gasoline, to cost in 20 years.
3) Could you mention, specifically, what “technological improvements” you expect to produce more liquid hydrocarbons?
Thanks
Hi Anonymous,
Here are my answers:
A) EROEI of Canadian oil sands, the least attractive of the chain, currently stands at 5-6x and goes up to 7.5x when using co-generation for power. Shale oil at multi-stage horizontal fracking is as high as 9.5x. Average of conventional oil even on deepwater is well above 10-11x. As such, I expect average oil EROEI to stand above 9x with heavy oil and NGLs included even in twenty years.
B) Depends on the devaluation of the US$, which I expect to continue, and on taxes, which take up to 60% of final price in many countries…but if we assume constant US$ and no more money printing from the Fed, gasoline and diesel will actually fall albeit small, because refining margins will collapse further (they already are in that process) due to structural overcapacity. Of course this is before taxes. Remember that in most countries in OECD taxes take up to 60% of final price and in the US the govt wants to impose a gas tax. This assumes an annual demand growth of 1.5%.
C) There are several strong developments in lateral drilling and reservoir optimization already used and new ones being tested. Productivity is improving almost every year in secondary recovery, that is why independents are so successful compares to oil giants. More importantly, drilling horizontally and tertiary recovery techniques have only started to be applied massively. If you allow me, I will expand on this soon, as I intend to write an extensive article on this soon.
All the best
Oil demand globally to peak before 2020 http://www.telegraph.co.uk/finance/newsbysector/energy/oilandgas/8872941/Oil-demand-globally-to-peak-before-2020.html
A small correction – the rate of discovery rose from *5* billion barrels per year to 55 billion barrels per year in the period 1945 to 1968, not from 20 billion as I typed. The precedent set by historical discovery performance has been even better than I suggested – please accept my apology.
Dear Rich, your comments are too good and valid to be “only” commented. If you agree, I would publish your comments as a post (if you want to sign it) and go point by point on another post. Do you agree?
Daniel – I thought blogspot was playing tricks. I’d be delighted.
good details on oil