Tag Archives: Energy

Peak Oil Defenders’ Most Overlooked Myth: EROEI

“So long as oil is used as a source of energy, when the energy cost of recovering a barrel of oil becomes greater than the energy content of the oil, production will cease no matter what the monetary price may be.”– M. King Hubbert

Yes, friends, if EROEIs of unconventional and new oil production were as low as some defend, the industry would simply abandon those resources.

Peak Oil defenders continue to make new claims. While inventories reach the highest levels of the past five years, OPEC fights to keep quotas and for a third consecutive year reserve replacement remains strong, in a world that has not seen a single day of disruption in oil supply, the defenders claim that the problem is EROEI (energy returned on energy invested) and that therefore, it doesn’t matter if supply is abundant, because it is still negative.I had the pleasure of talking with industry leaders and this is their response.

eroeia) The concept of EROEI has to be clearly attached to profitability. Peak oil crash defenders scream at 4:1 levels as unsustainable. This is funny. An “alleged” low EROEI is not necessarily a negative in itself, given that low cost of capital and high technology developments have helped to have readily available and abundant energy all over the energy complex (not only in non-conventional, but in conventional resources), and there has been no issue with supply in any environment despite a few geopolitical bumps. Furthermore, that EROEI rises as efficiency and productivity help reduce power use and increase output.

b) The concept of EROEI is static, it uses an estimate of energy consumption that starts at an intensive point and that just stays or rises afterwards, and this has proven to be wrong (energy used per unit produced falls dramatically in virtually all industry projects, see Shell’s analysis of oil sands extraction).

c) If EROEI estimates published by peak oil defenders were correct, given the gigantic increase in E&P and non-conventional spending we have had, power usage, and electricity prices and gas prices would have rocketed… But they have fallen. Co-generation is barely considered by EROEI doomsters either.

More importantly, in projects as energy intensive as PNG LNG, cost of energy used has fallen by 34%.

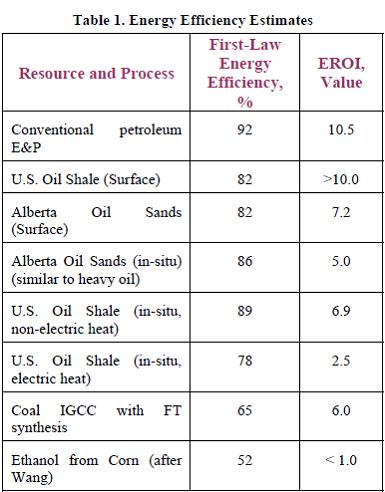
In Oil sands we have seen drops of 25% per unit of production. In shale oil as dramatic as 34%. The graph below shows the EROEI estimates of the Department of Energy in 2006 (link here). This was in 2006. Since then the efficiency and lower use of power and energy in hydraulic fracking and oil sands extraction has significantly increased the EROEI.

d) EROEI is an excuse of peak oil defenders to justify that they have been wrong about supply, turning the debate to the alleged unsustainability of that same supply as a justification.

Finally, any of the peak oil defenders needs to explain how the development cost of the industry has fallen, the energy intensity of the industry has gone down dramatically (they don’t read companies sustainability reports?) yet reserves and production have improved 2006-2010, fundamentally in unconventional.

The EROEI theory takes an individual projection (and this is typical for peak oil), leaves the negative elements untouched and stable (as if techonology and resource development did not improve) and then expands it to the entire base.

This, obviously, leads to a massive generalization and a leap of faith that can be easily denied just looking at 20-F filings, detailed analysis per project, which are available to all shareholders in strategy presentations and Fact Books, and in the brutal fact that oil sector’s electricity and gas consumption has been falling while productivity, particularly in non-conventionals, has soared.

Never bet against human ingenuity.

Further read. The Oil Drum (link here):

On EROEI of oil sands

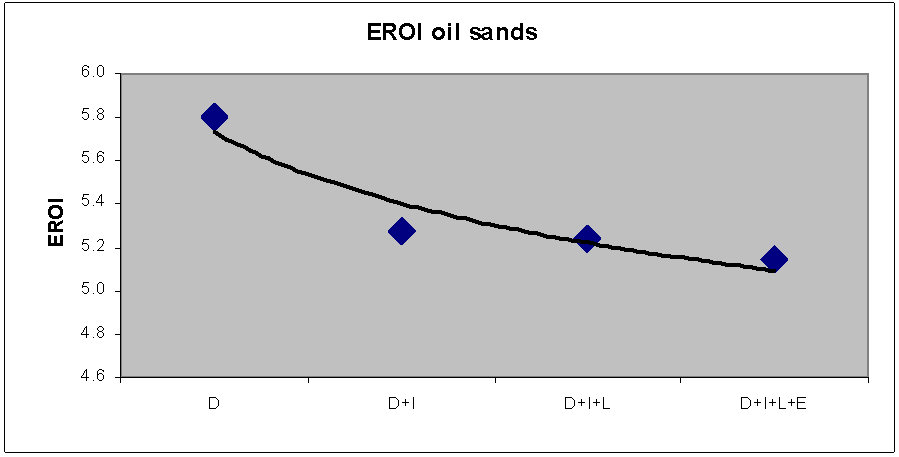
“EROI depends mostly upon the direct energy used and which alone suggests an EROI of about 5.8. Including indirect energy decreases the EROI to about 5.2”, “adding in labor and environmental costs have little effect”. “Nevertheless it appears that tar sands mining yields a significantly positive EROI”.

On shale oil “Reported EROIs (energy return on investments) are generally in the range of 1.5:1 to 4:1, with a few extreme values between 7:1 and 13:1”. “Tar sands and oil shales seem to be in the same EROI ballpark”.

EROI_oilsandsNote from Daniel Lacalle: Worth noting that the assumption of energy consumption in the article for shale oil is now widely seen as excessive, so real EROEI is currently close to the latter part of the analysis (7x to 13x)

Further read:

http://energyandmoney.blogspot.com/2009/11/peak-oil-realities-myth-and-risk.html

China Slows Down… as Saudi Arabia Accelerates?

midterm oil mkt balance

(This article was published in Cotizalia on Thursday, 16th June 2011)

The Oil & Gas sector, the world’s most profitable and less indebted one, will invest in 2011 for the first time in its history more than $500 billion in exploration and production alone. The level of value creation and development that these investments generate can not be compared to any other industry or sector in the world, and if we include gas and refining they will reach a total of $790 billion.

Saudi Arabia announced this week an increase in production, showing the frustration they have after being one of the few OPEC countries to comply with the quotas. Imagine, if they presented themselves later this year at the next meeting and see that OPEC produces 26.2 million barrels/day (when the quota is 24.9) and found that the output gap between them and others had widened. Iran, for example, has increased production by 45,000 barrels/day (to 4.24 million barrels a day) despite a 35% drop in oil investments since the beginning of the embargo.

Saudi Arabia will not appear at the next OPEC meeting as the only good boy in the class with homework done. Because if quotas are revised up, then everyone has to start from the same base, and there is no evidence that the other OPEC countries will decide to reduce their current output.

2011060855Sin título-1 copia (1)

Anyway, it’s a good decision which, together with increases in other countries over the quota, partially mitigates the effect of the lost Libyan barrels. Partially because Libyan barrels are of exceptional quality and the oil that is to replace them is heavier, making it difficult to replace, for example, in the Italian refineries.

In the last three weeks I have seen over twenty-five executives from oil companies, including all the big oil companies and if there’s a comment that is repeated each time over and over it’s this: Almost no one believes the sustainability of demand in China. And watch out for the estimates of the IEA, EIA etc., which use “diplomatic” data, especially in their demand models, where the estimates depend on GDP projections which are generated by the governments, which have a nasty habit of being wrong (as a fun exercise, look at the growth estimates published in 2006 for 2009).

As John Watson, CEO of Chevron, says, if the industry had listened to these agencies in the past twenty years, or whomever recommended them to “improve” their cost of capital by re-gearing, the sector would all be in bankruptcy.

I already commented briefly on the Chinese slowdown here. To follow up on those comments, hese are the arguments from the industry, and from my own analysts in Hong Kong to question China’s demand sustainability:

a) Sales of cars do not match with demand for gasoline and diesel. Apparent consumption of gasoline remains at 6.1 million tonnes and 13.86 million tons of diesel. These figures are much lower than the sales of cars and trucks would indicate (with 1,382,770 vehicles sold in May).To give you an idea, using the model of China’s own state expected evolution of consumption by type of vehicle, demand for diesel and diesel is suspiciously 12% less than it should be. The theory advocated by many investors that many of these vehicles remain parked without use is at least plausible.

b) The apparent oil demand in China remains around the 39 million ton figure for months. With seasonal changes, of course, but total demand has not exceeded 40 million tons since September. If we add that industrial production began to show signs of weakness (falling from 14.2% in 2010 to 13.3%), growth was generated primarily by fixed capital expenditures… just as the Chinese government begins to take measures to cool the economy .

c) This demand has been maintained but inflation has continued to grow (mainly because of food, +11.7% in May) despite the government’s containment measures. If the government sets as a priority to curb inflation (+5% now compared to target of 4%), the impact on oil demand can be significant.

d) The estimates of per capita consumption growth are inflated . China consumes 6.2 barrels per day of oil per thousand people (EU consumes 27). That number seems small, but we must not forget that Hong Kong consumes more than 43 already, and the largest cities of China consume up to 24.6 barrels per day of oil per thousand people. So the upside is exaggerated.

The risk for analysts who think China will grow exponentially is that they assume that demand will be the same as in the cities in rural areas, and look at Russia and Brazil. Patterns are very different. In addition, China already consumes almost 10% of the oil in the world with a GDP of $6 trillion (versus $14 trn in EU), as we mentioned last week .

I still think that the short-term risk of a significant correction is not small. As in 2008, the ingredients are there: massive increase in investment in oil, excess crude inventories that are still too high (at highs of five year levels), increased OPEC production, which still has 4.5 million barrels/day spare capacity … just as demand slows in China, and a general environment in which estimates of OECD GDP appear too high, at least by 0.2-0.3%.

I can be wrong, but at least I think it is good to see that the oil sector takes the data from China with caution. That is why it’s the world’s most profitable sector. If the data are true, the group ROCE will exceed the historical 23%, and if they are wrong the sector will remain comfortably safe thanks to a very low debt (aggregate and individually).

Iran grows output despite embargo driving a 35% fall in oil investments

iran_major_oilfields78 (1)
According to BP’s latest report, the Statistical Review of World Energy, Iran’s daily oil production climbed 45,000 barrels compared to the 2009 figure. This increase comes despite the embargo having impacted oil and gas investments by 35%. if investments had remained at the level of 2005-2006, Iran could have posted the highest production growth of all OPEC countries (ex-quota changes).According to a friend at NIOC, lack of investment stands at the heart of the challenging environment for Iran oil output, not the quality of the reserves. In fact, according to Shell and ENI, Iran is a “dream” in terms of recoverable reserves, with low costs and high productivity. The only problem, as Total’s CEO pointed out as well, is the embargo, which could turn rapidly if the current regime changes.

Despite the positive 2010 figures, Iran could face a sharp drop in crude oil production due to sanctions and the lack of foreign investment. The Oil Ministry has determined that Iran would see a 30 percent decline in oil output given the 35% (average) drop in investments, unless the government attracts major foreign investment to the energy sector. The Teheran regime has set a requirement for $150 billion in investment for the period 2010-2015 (which would be in line with normal estimates and bringing the average capex back to historical pre-embargo levels).

“If the investments are not realized, the country’s oil output will drop to 2.7 million barrels per day,” Iranian Deputy Oil Minister Mohsen Khojasteh-Mehr said.

Under the ministry plan, Iran’s output capacity would increase from the current four million to 4.7 million barrels per day by 2015. Natural gas capacity, the focus of $75 billion in investments, would rise from 600 million to 1.47 billion cubic meters per day.

Average Iran’s crude production in 2010 stood at 4.245 million barrels per day, and the country’s natural gas production posted a 5.6 percent increase to settle at 138.5 billion cubic meters in 2010, the report said.

According to the BP report, Iran produced 5.2 percent of the global oil output, and 4.3 percent of the total natural gas production of the world.

Iran ranked fourth in the world in terms of crude production after Russia, Saudi Arabia and the United States. The Islamic Republic is also fourth in gas production after the US, Russia, and Canada, has the world’s second-largest crude reserves after Saudi Arabia and the second largest gas reserves after Russia.

Moreover, BP also stated that Iran has proven oil reserves that would last for the next 88 years, the second longest-lasting oil source in the world.

On a different note, and based on the reserves-to-production ratio index, UAE will be the prominent source of oil for the world with oil reserves that would last for the next 94 years.

The Debacle of Solar and ‘Tariff Support’ Models

images(This article was published in Spanish in Cotizalia on June 23rd 2011)

Solar stocks are the worst performers again, despite the Fukushima hype and extremely generous tariff support. The solar sector (January to June) is down 10% versus the renewables sector down 5.8%, and some of the most abrupt moves in solar are in Q-Cells -33%, REC -41.5%, Phoenix Solar -26%,  Renesola -49%, E-ton Solar -50%, China Sunergy -56%.

The reason why the sector continues to collapse like a falling knife is that it has not proven how they can make any money unless there is dreamtime-like expansion.

We tend to believe that tariffs that support volume growth but cut prices more rapidly will benefit the industry (and equities) as a whole more, but hurt higher cost participants sooner. It is wrong. Because the sector starts from overcapacity and excessive cost and even with costs falling 39%, and subsidies that guarantee on average €180/MWh they still lose money.

Developers in regional markets in some cases would prefer capacity caps with higher tariffs, thus enjoying the spoils of overcapacity-driven solar ASP (average selling price) pressures from their suppliers. The Asian manufacturers have zero discipline in capex or growth, they need only a 3-month price signal and they further expand, which virtuously keeps driving down the cost. Something like 10GW of new manufacturing capacity (40%) is coming online during 2011, while demand (global) is expected to rise about 15% at best.

The big ‘if’ is if Italy imposes an annual 2-GW/yr cap on installations; if they do, most of the marginal players in Asia will have nowhere to put their last 20% of production and we have a rapid fall in prices, margins and profits which then will lead to the proverbial ‘boom/bust’. But before then, we would expect margins to compress by 50% or more in some cases in the food chain, as we saw in wind–could see stocks fall 20-40% over the summer.

If the industry were logical and wanted to lower the cost of solar – what should it do? If you assume 1600 kWh/kW capacity factor, €35c/kWh FiT (Italy), and assume that the installations are made from 2012-2016, the €6bb/year economic burden by 2016 translates to ~2.1GW/year from 2012-16.

If the industry instead accepted a €25c/kWh FiT (~30% cut), the industry could support a 3GW/year cap at the same economic burden. If the industry accepted a €20c/kWh FiT (~40-45% cut), the industry could support 3.75GW/year. If the industry accepted €15c/kW FiT (55-60% FiT cut), the industry could support 5GW/year. If the industry accepted a 55-60% FIT cut and used that as a basis to support a higher economic burden of €6.9bb/year, it could support a 5.8GW/year limit for PV.

Will they?. I doubt it. The Chinese companies have 50GW of capacity for a 20GW market. Companies are unable to achieve IRRs of 10% with subsidies of $140/MWh (US), €230/MWh (Germany) or, brace yourselves, €400/MWh (Spain), all PV solar. This is, on average between 4 to 10x the average price of power in any of those contries… and companies still are unable to make more than 10-12% IRR despite a fall in costs of 38-40%!!

In the first quarter of 2011, the average selling price (ASP) of solar modules fell again like a rock. ASPs fell c45% globally while costs fell a slower ~37% pace. So in essence, prices fall more than costs and, as overcapacity grows, the downward trend is exacerbated by working capital requirements. A race to zero? probably, unless capacity retirements really start and companies streamline their debt. But capacity cannot be slashed when the main competitors in all parts of the chain, Chinese in particular, but Germans too, have a capital allocation policy based on growth at any cost.

At the heart of this we have an over-leveraged industry: 80-85% at project level is already unsustainable, but the companies are leveraged also at the holding level, making total gearing to the tune of 5-6x Net Debt to EBITDA. Overcapacity in all parts of the value chain, from wafers to poly-sylicon and development stands at more than 50-60% on average, and competitors (not just Chinese, Germans too) show low capital discipline and imperialistic market share aspirations. So at the minimum price signal (a tariff announcement, a government renewable plan confirmation), capacity grows way above demand. And despite the fall in costs, it is astonishing to see the companies unable to get their head above water. Working capital requirements eat any equity IRRs and debt obliterates the profitability. Add to this overcapacity and no wonder you ave seen 40-50% falls in stock prices in solar.

The Asian build more and more capacity, however some part of the production chain are much easier (from a technology and timing stand point) and cheaper to add than others. To simplify, the lower in the value, the easier/cheaper it is to add capacity. As a result, the value chain today would look like an inverse pyramid with more capacity downstream than upstream:

From upstream to downstream the value chain is:
– Polysilicon
– Wafer
– Cell
– Module

As cell capacity grew larger than wafer, demand for wafer was tight and wafer ASP shot up, squeezing cell margins. Then with this positive price signal at the wafer level, Asians have added wafer capacity. As a results, there were more wafer capacity than polysilicon available. Wafer guys margin got squeezed and polysilicon guys reaped all the profit. In Q1 11, the CAPEX for polysilicon for Asian companies could be recouped within one year as spot price for polysilicon was so high (gross margin >50%). Now overcapacity looms, gross margin collapsed and we are at the tipping point where polysilicon companies still need to lower their margins otherwise the whole industry will come to a halt. Presently, wafer and cells producers are barely earning a gross profit.

If you wanted to be cynical, you could say that the Germans and Spaniards actually tricked the Chinese by sending positive price signals for a few years, enticing the Asian the build, build and build, and now that there is massive overcapacity, cost of PV is likely to be close to grid parity. But companies are in dire straits and making poor returns, so any cut in tariffs obliterates them.

As the ability of governments to keep those supernormal subsidies dies (85% of subsidies for solar are in Europe, mostly Germany), the industry is condemned to a massive re-structuring.

Solar returns are collapsing DUE to the big subsidies. Subsidies created this industry and are now part of its demise. They created artificial signals for demand and then ultimately supply. Now, supply is in trouble due to overbuilding/expansions. Is it temporary? Maybe, and if “temporary” means 5 years it will be death for many, but margin compression is not.

Solar energy is not a problem as a concept. Greed fuelled by government-led price signals, that fade as quickly as they come, added to unsustainable debt and undisciplined capital allocation is the problem.

Related posts:

http://energyandmoney.blogspot.com/2011/03/anti-nuclear-state-of-fear-japan-and.html

http://energyandmoney.blogspot.com/2011/01/some-energy-thoughts-for-2011.html