Tag Archives: Energy

Unsustainable energy policy, higher debt, higher unemployment

(This article was published in Spain’s Cotizalia on 31st March 2011)

Beware. The European Union, Germany and the UK have implemented some of the most harmful energy measures both for their economies and, ironically, for the objectives they strive to achieve.Let us review the measures and their consequences:

. 20-20-20 Roadmap : The goal that forces to impose a 20% of renewable energy in the electricity mix hides behind its seemingly ambitious and unanimous goals the danger of percentages. As absolute targets are not specified, the cost of the measure is higher for smaller countries. 20% of renewables in a generation park like the German, 120GW (giga watts) is not the same in cost (subsidies, tariffs, investment in new transmission networks) than for a country like Portugal, Spain or Greece. Even more if we compare it relative to GDP.

Achieving that goal will cost Germany (if they implement it) that is an economy 2.8 times larger than the Spanish, the same as for Spain in subsidies and extra-cost of networks, but only 0.3% of GDP, while in Spain it’s almost 1%. This restricts the competitiveness of small countries compared to its EU partners, but even worse compared to the rest of the world. It removes the ability to recover the economy and therefore create jobs. In energy, costs are everything.

Studies of the Universidad Juan Carlos I (“Study of the Effects on Employment of Public Aid to Renewable Energy sources”), and six other universities at European level have quantified the loss of jobs by the introduction of the so-called green economy (badly called green, because it does nothing but increase the consumption of coal, which had been deemed obsolete) in 1.8 jobs lost for each created.

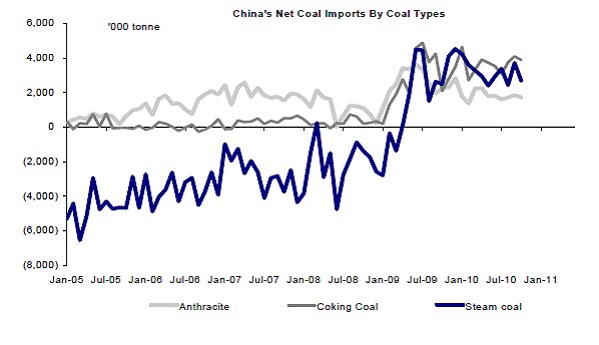
. Decommissioning or closure of nuclear plants : If 7GW of closed nuclear plants in Germany do not return to work, this means increasing by 8 million additional tons of coal imports to Germany. If they stop all new nuclear projects globally, coal consumption will increase by 80,000 tonnes between 2010 and 2020. And nuclear generation is “base-load” (ie, works almost without a break), so can not be replaced by renewables in its entirety. And this leads us to gas. The importance of natural gas as back-up in the energy mix will make energy dependence (a term I find ridiculous) increase. An Ostrich type of anti-nuclear policy, because in the middle of the EU we have France with 58 nuclear reactors, but some seem to think that if there is a radiation accident it will stop short at the border.

. Minimum price for CO2. The UK does things as badly as anyone, and has shown it this week. Intervening in the market and imposing a minimum price of CO2 while raising taxes on gas production in the North Sea has managed to increase consumption of gas by 15% at a higher price. In addition, the UK has increased dependence on foreign energy by forcing the closure of several projects, over $10 billion, in exploration and production in the North Sea. And a loss of 120 jobs in the first day. Success!.

The European Union plans as if the world was limited to our 27 countries. The EU is 13% of world coal consumption and 16% of natural gas. But supports 100% of the cost of CO2 and 70% of the cost of premiums for renewables worldwide. Thus the effect of their actions is amplified by the loss of global competitiveness in a group of highly indebted countries.

. Remove petrol and diesel transport by 2050. Again, without calculating the cost or impact on the economy. We are “only” talking about a cost close to twenty-six billion euros only in costs of network infrastructures. But most importantly, these do not reduce energy dependence or improve costs. Electrifying the park could reduce oil consumption (paradox, to be more competitive again), but will increase coal and natural gas prices, and adding to the renewable premiums, taxes lost from petrol and diesel, over 56% final price, will be transferred to the consumer of electric cars in the power bill.

We must not forget the impact of these measures and their cost of implementation, the impact on budget deficits and on the battered state of European countries’ debt. To add a cost to the system involving another 1-1.5% of GDP on debt with “supposed” benefits in 2050 has an enormous impact on employment and working conditions. At the end of the day in most companies the four major costs include energy, taxes, debt costs and wages. If the first three parts rise disproportionately, the third invariably suffers.

Besides, these measures have a minimal effect at European level, let alone globally. Only the planned investments in coal plants in China offsets all efforts of the EU to meet the Kyoto targets. Thus, the weight of coal as global primary energy source increased by 1.3% in 2010 to 52.3%.

And do not forget that apart from xenophobic arguments about good and bad countries, which are embarrassing, the cost of the “ostrich policy” of energy self-sufficiency that they want to impose far exceeds (all costs included) the equivalent of $700/barrel (source: CERA, Utilities Weekly). And who do we expect to sell the haemorrhage of debt we will issue to achieve the above objectives? … the oil-producing countries, China and the U.S… Amazing.

It is rather sad that the “success” of Europe in its emissions reduction target is due mainly to the displacement of its energy intensive industries to the Far East, with the consequent loss of European jobs, and the effect of reducing industrial demand runaway that the debt orgy has generated. A success. And to close the circle, it has increased the energy dependence from Russia, Qatar (gas) or Australia and South Africa (coal).

What about pollution? We forget that the rare earths required to manufacture solar panels and batteries pollute hundreds of thousands of tons of water per year. But it pollutes in China (97% market share), so no problem.

These measures give off a smell of stale paternalism, or as Professor Dieter Helm would say, “the addiction of politicians to” roadmaps “that set the future direction of energy with Soviet precision”. And with the same disastrous results as the ridiculous five-year plans.

Until governments stop trying to plan and intervene in the energy market like the rest of the world did not exist, they will be doomed to failure. And we have spent many years with dreadful results. The green economy, which seems phenomenal, as long as it doesn’t have to be paid by my grandchildren, will only succeed if it is competitive. Governments should only create a reasonable and stable regulatory framework for technology and let the market offer solutions. Competing.

Egypt: A brief guide to the energy implications of the unrest

Egypt: A brief guide to the energy implications of the unrest

Egypt: A brief guide to the energy implications of the unrestHere is a summary of my views on the Egypt crisis, stocks involved and how to play it.In terms of oil, none of the countries presently affected is a major producer in a global context of oil (1.1mb/d). Yemen and Egypt are important for gas markets as significant producers of LNG for international supply (20mtpa/ 8% global capacity). However, they are very important for low cost deliveries to Europe and for South Europe refiners (Repsol gets part of its crude for Cartagena and ENI for Toscana from Egypt).

The threat of contagion within the MENA region (Algeria, Bahrain, Djibouti, Egypt, Iran, Iraq, Jordan, Kuwait, Lebanon, Libya, Morocco, Oman, Palestinian territories, Qatar, Saudi Arabia, Ethiopia, Sudan, Syria, Tunisia, United Arab Emirates and Yemen) is what most analysts see as most worrying. I would categorize the risk as low in the pure arab states (Saudi-EUA-Kuwait and Iran) and higher in Algeria, Jordan and Syria, where civil unrest has been highest (food prices up 59% in Jordan and Syria while unemployment soared). Out of these, only Algeria is a serious threat to global supply of gas.

Algeria has 159 trillion cubic feet (Tcf) of proven natural gas reserves – the tenth-largest natural gas reserves in the world, and the second largest in Africa. Algeria produced 3.08 Tcf of dry natural gas in 2010, and consumed 1 Tcf of dry natural gas domestically.

Egypt consumed more than it produced for the first time in 40 years in 2010.

Egypt’s EGPC is a strange animal as it does not operate any of the licenses in the country, but foresees the developments and takes the money. Most of the production is offshore or in the Western desert and has not been affected by the riots. As an example, in the past 20 years of presence of Apache in the country there has never been a change of license or nationalization. Egypt also has a very advantageous (for the country) taxation system, local content employment requirements and now that is a net importer, needs more from IOCs than ever.

The final risk is the possibility of disruption to the smooth passing of ships through the Suez Canal. So far this has been denied as a threat.

Companies exposed to Egypt and Algeria.

If we establish the low(er) risk of disruptions in Saudi, Iran, Iraq, etc… The key companies exposed to the Egypt problems are:

OMV, REPSOL & ENI have the largest exposure with c.20% of their commercial reserves in the region.

ENI’s Egyptian exposure is 14% of group production and 7% of upstream value. However, ENI is the most exposed to North Africa and the MENA with additional risk to supplies to Italy from Egypt and Algeria. Eni has a limited exposure to Egypt but 36% to the region (including Libya and Algeria).

OMV has a 20% exposure to the region (mainly Lybia) and recently added exposure to Tunisia through an acquisition. OMV, Total and BP each gets 3-4% of their total production from Tunisia, Egypt and the Yemen in aggregate. However, Egypt, Tunisia and Yemen account for quite more than that in their growth strategy and give them the highest ROCE. Exxon also drills offshore Egypt but the exposure is negligible. Chevron and Conoco also only marginally present. Of the rest, exposure is also quite small, including Statoil with less than 10% upstream value exposure (mainly Algeria).

BG. Egypt and to a lesser extent Tunisia are relevant production centres with around 30% or 220kboe/d of its 2009 production. Worth noting it is mostly offshore, with a large presence of local workforce and that there has been no disruption to activities.

GDF-Suez, Shell. Jointly operate the Alam El Shawish concession in the western desert area of Egypt. In Egypt, GDF Suez holds stakes in two other offshore licenses: it operates and owns 50% in West El Burullus area (together with Dana Petroleum, bought by KNOC), where an initial discovery was announced in 2008 and has 10% in the North West Damietta licence operated by Shell (61%). In liquefaction gas, GDF owns 5% in the first LNG train from the Idku plant that delivers 4.8 bcm of natural gas annually and buys its total production. GDF SUEZ loads about 60 cargoes per year.

Gas Natural-Fenosa, Repsol YPF. Gas Natural owns and operates the Egypt Damietta liquefaction plant. The Egyptian government told Gas Nat-Fenosa to consider importing gas from abroad to meet the needs of the Damietta liquefaction unit located on the Egyptian Mediterranean coast, after the company suffered from a set back in its supplies from the gas national network during the first half of the fiscal year 2009/2010. The firm currently receives 320 million cubic feet of gas per day, 70% of it from the Egyptian Natural Gas Holding Company (EGAS).60% of natural gas delivered to Spain comes from Sonatrach (Algeria). Risks have increased in an ongoing and well-known dispute between the countries. Gas Natural lost the license for Gassi Touil in 2009.

RWE. In recent years the company made a number of major gas discoveries in Egypt and boosted its activities considerably with the acquisition of additional concessions. RWE Dea has a total of 13 onshore and offshore concessions in Egypt, across a concession area of about 13,300 square kilometres in the Nile Delta, Gulf of Suez and Western Desert.

EDF through Edison (Italy) Holds the $1.4-billion concession agreement for the offshore fields of Abu Qir, which has lost them money and were trying to sell or renegotiate.

Apache. Egypt is 21% of Apache’s production. Most of their assets are in the Western Desert. Apache is critical to Egypt as it drills 50% of all the country wells, supplies gas domestically at prices that are 60% below international prices, and employs 5000 Egyptians. Apache pays $11m a day in taxes to the treasury.

Premier has a very small exposure to Egypt (only 20% stake in a non-operated field).

Of services, Halliburton and Schlumberger undertake around 70% of the oil and gas service contracts in Egypt. Transocean has 10 jack-up rigs in Egypt, more than any other company, although six of those rigs are either cold-stacked or idle. Diamond Offshore has 3 rigs, 8% of its total rig count. Rowan Companies has 1 rig, but it wasn’t in use as of this week. Petrofac had a contract in Egypt that finished in December, and has no further exposure to Egypt but is very exposed to MENA region (15-20% of backlog). Saipem and Technip also have c20% of backlog in the region.

The biggest threat in my view is to the big IOCs and utilities who tend to solve these issues through paying up, and losing returns.

Play the oil and gas spike through utilities (generators with no Egyptian MENA exposure) and high oil geared explorers and producers more exposed to LatAm, US and especially Russia. Gazprom will love this MENA problem.

I see services relatively unaffected once the risk of oil and gas field shutdowns is clarified. In the Iraq war and other risky geopolitical environments the specialized names benefited from the need to protect and continue operating the oil and gas fields. However, the short term impact will likely continue to be negative. This is also bad for southern european refiners because their low cost oil comes from Lybia and Egypt and the refining margins will likely fall as oil rockets but heavy-Brent spreads collapse.

Further read:

http://energyandmoney.blogspot.com/2011/03/war-in-lybia-and-possible-algerian.html

http://energyandmoney.blogspot.com/2011/02/lybia-in-flames-and-clash-of.html

http://energyandmoney.blogspot.com/2009/11/china-exxon-and-war-for-resources.html

Continue reading Egypt: A brief guide to the energy implications of the unrest

Some energy thoughts for 2011

coal
(This article was published in Spanish in Cotizalia on December 23rd 2010)

First of all, dear friends,I wish you all a 2011 filled with peace and prosperity.

As this is a time of predictions, and last year I was not very wrong, I’d like to leave my humble opinion on what 2011 can bring us, I see as a year of consolidation of trends in 2010: OECD decline up to their eyeballs in debt, low rates and more inflationary monetary policies.

. Oil at $105/bbl due to increased emerging market demand . With +1.5 to 2% oil demand growth in 2011, 75% from emerging markets, crude oil inventories should be reduced to levels close to the average of the last 5 years. Global demand will continue to be dominated by growth in China, India, Latin America and the producer countries. Pay attention to demand. It’s all that is going to move prices. Do not bet on peak oil theories or supply shortages in 2011. OPEC still has 5 million barrels per day of spare capacity, and we will see Russia confirming its 10.2mbpd output, while Saudi Arabia could easily increase production by 1mmbpd if needed. The world economy has shown that oil at current prices is not a problem. A high price is a sign that the economy works, companies are investing more in exploration, they discover more and the total cost to consumers does not rise due to crude prices, but due to taxes. The cost of fuel is less than 25% of the cost of airlines, and a tiny percentage of the final price of petrol and diesel (55% -60% is tax).

We have oil for many decades. More than sixty years of demand in proven reserves. And rising. In 2010 the replacement rate of global reserves will exceed 100%. And with a 17% increase in overall investment in exploration and production, the chances of a global reserve replacement of 100% in 2011 are very high. And probably in the coming months we will see major innovations in unconventional oil, as we saw in shale gas. If oil stays above $60/bl, as expected, investments in new unconventional reserves, which rose 230% in the past five years, will continue to grow.

Bad year ahead for Iraq and Nigeria. The price of oil is not flowing to the people and patience is being exhausted. We are seeing new security problems in the Niger Delta, and I think in 2011 we will have some major scares. In Iraq, the war is now administrative. On a recent visit to Baghdad by a group of investors, companies made it clear. With no stable government, no legal clarity and security to invest, it is impossible to reach 3-3.5 million barrels per day of production. Beware of listed exploration companies heavily exposed to Iraq especially those that rely to Kurdistan to work.

I still see a positive environment for service companies that benefit from increased investment, from Petrofac and Seadrill to downstream-heavy TRE. I am still cautious on seismic names. Capacity is way too high and increasing, while demand has not recovered to absorb the already high supply, so margins are not going to rise easily. As for independent exploration and production companies, the war for natural resources will accelerate M&A, and growth new frontiers. Focus on Tullow, Soco, Chariot, OGX, Cairn, Anadarko and Novatek.

M&A in Oil & Gas will surpass the $150bn mark set in 2010. Large companies have to find truly transformational deals to drive growth that has been so elusive in 2000-2010. More shale gas ventures in the US can be expected, but I believe the focus will be in frontier areas: West Africa and LatAm.

Refining margins are likely to do nothing as the economy recovers but overcapacity continues to dominate the refining sector. We had 7mmbpd of overcapacity and this is rising, with 370 refining projects in 90 countries around the world in the next five years (UBS source).

. Coal, Coal, Coal. Coal at $140/MT. China burns 55% of the world’s coal, and that number is expected to rise by 65% over the next five years. China has half the U.S. GDP and consumes 3 to 5 times as much coal. And in India and the rest of Asia the situation is similar. Despite the environmental rhetoric that we use, these countries do not have to cut their growth just because we say so. Meanwhile, the supply problems will continue, with the protests of organized groups in Newcastle and flooding problems in Australia. As of today, c.100mMt of annual coking coal production (c.40% of the global supply) is under force majeure arrangements.

. Weakness of carbon dioxide (CO2). You know it, that “fake commodity” artificially invented, where demand and supply are imposed by political entities… and it still does not work. In 2010, CO2 has barely kept the €14/MT level. Neither Copenhagen, or Cancun, or the efforts of several investment banks and environmentalists have helped to raise the price. The alarms bells are ringing and there are voices calling for imposing a minimum price for CO2. Interesting. The interventionists were rubbing their hands at the prospect of increasing the price of CO2 through more than questionable environmental policies, and now they need to find inflation through imposition.

The supply of CO2 (EUAs) exceeded 24.8mMt in November (a record) and 24.4mMt in December. With the European Union and OECD undergoing a very slow recovery in 2011 and the most environmentally committed countries experiencing huge debt problems with c$300 billion to refinance in 2011, the excess supply will increase.

The companies benefited in this environment may be the traditional power generators.

Beware of turbine manufacturers. 2010 was no exception, it was the the beginning and the fall in new installations will continue impacting a sector with significant overcapacity. Europe new installations will be flat at best, China up 10%, US flat at best, rest of the world +5%, driving a +5% to +13% growth in the global market… while manufacturing capacity, which was already too high, has increased by c8%, driving a 39% oversupply (MAKE, GWEC source).

. Natural Gas to suffer for another couple of years. A bad nat gas year is one that sees the price of Henry Hub at $4.5/MMBTU amid the coldest winter of the last ten years. In 2011 we will continue in a complex environment. Liquefaction capacity increasing by 10BCM, shale gas production increasing by 6% and a very slow recovery in demand for electricity. The NBP (UK) price will continue to support the $7/MMBTU equivalent thanks to the decisions of Qatar, Norway and Russia to control supply. The liquefied natural gas sold to Asia will continue to trade at a premium over Europe, but a significantly lower one, as supply problems in Korea, Japan and China are eased.

Of course, a volatile gas market benefits the companies that profit from arbitrage between markets, like BG Group, but also to a lesser extent, Statoil and Shell. The losers are still the Central European power conglomerates heavily exposed to gas, and companies like Gazprom, which will again have to renegotiate some contracts.

. The nuclear renaissance is delayed, but it is happening. Low power prices, weak gas and excess capacity have delayed plans in the UK and other European countries to increase their nuclear fleet. But if they care about the environment and strive to reduce CO2 emissions, the nuclear option is the only real alternative to achieve these goals. The nuclear renaissance is inevitable in China, Russia and other countries. 56 reactors under construction, 20 of them between China and Taiwan. More than 180 gigawatts of new nuclear capacity through 2024.

The winners in this environment are the equipment companies that build new plants, Siemens, Alstom and Amec. Nuclear-heavy generator stocks are more dependent on the evolution of power prices. And in that area, in 2011, again we will see major differences between countries with capacity problems (Nordpool, with hydro reservoirs at 24%) and over-capacity countries (Germany, Spain, Italy). In Europe power demand growth in 2010 (+3.5%) did not offset the fall of 2009, while capacity continued to increase (predominantly solar and wind). This is not a positive backdrop for power prices throughout the continent.

Further read:

http://energyandmoney.blogspot.com/2010/01/energy-predictions-for-2010.html

Can Oil and Nat Gas go back to historical parity?


(This article was published in Cotizalia on December 16th)

oil gas sobrecapacidad

We discussed many months ago that the link between the price of natural gas compared to oil broke in mid-2006, reaching a historic high gap in 2010.

Why natural gas and oil have “de-linked”

a) Natural gas is used mainly for power generation and heating. Oil is used primarily for transport. Natural gas demand has suffered from falling electricity demand in the OECD, which has slowed down aggressively between 2007 and 2010, and most countries face problems of overcapacity in generation after the growth of renewables and thermal capacity. Meanwhile, oil demand has remained almost constant between 2007 and 2010.

b) The revolution of U.S. shale gas, which is approaching Europe from Poland, has increased the reserves of gas dramatically (and growing production in the U.S. by 15BCMs per annum despite Henry Hub trading at historic lows, between $4 and 4.5/MMBTU). Meanwhile, oil reserves, which have also grown with the discoveries of recent years, have not increased so dramatically even when in 2010, as was in 2009, we will have a global reserve replacement ratio exceeding 100%.

oil gas curva 2

Of course the anti-oil lobbyists say that there are only 40 or 60 years of oil (depending on whether or not we include NGLs), but the reality is that there’s plenty of oil. Plenty but not necessarily “cheap”, if we assume $40-50/bl as benchmark. Because oil is very cheap indeed. One of the world’s cheapest and most productive liquids. In 1991 when I started in the oil industry people said there were just 20 years of reserves, and now there are 60 (proven). And after the discoveries of Brazil, we will continue to see a very solid replacement ratio. Wait till we see the results in the Arctic, new frontiers, etc …

c) The shale gas revolution and LNG have lowered the marginal cost of natural gas, while in the oil complex, the marginal cost has stayed flat even in the downturn, as the oil complex re-rated due to the increased technical costs and more complicated geologies.

d) Additionally, the price of natural gas has been affected by a very significant increase in liquefaction capacity (more than 15BCM per annum to 2013), while in the oil market supply challenges remain. Oil-on-sea stored in vessels was rapidly consumed in 2010, and despite OPEC claims of almost 5 million barrels a day of spare capacity, the supply-demand balance has tightened.

oil gas curva 1

These fundamental shift in supply and demand fro both commodities has made companies enter a process of renegotiation of oil-linked long-term gas contracts to achieve a higher level of spot indexation, suited to a more cyclical and flexible power demand environment.

The Future

It is worth mentioning the huge difference between prices of liquefied natural gas sold to Europe or Asia. This shows how each gas market is very different and regional. On the other hand, the oil market is global and, despite talks of electric vehicles and other inventions, Asian demand and the traditional use of oil for transport will not vary dramatically.

In the fourth quarter of 2009 the average prices of LNG varied between $4.5/MMBTU (Spain) and $ 7/MMBTU (Korea). But between the second and fourth quarter of 2010, Asian demand and a colder winter have led liquefied natural gas prices to reach levels of $9/MMBTU (Spain, Japan and Korea). In oil, most countries are seeing that the price of crude in local currency remains very attractive, due to the collapse of the dollar, especially for China, whose dollar reserves fall in value every month. That is why demand has not fallen despite the poor economic environment when oil surpassed $90/bl. As the president of OPEC stated, oil is trading closer to $70-75/bl in constant dollars for them.

In summary, it is hard to foresee an environment in the short-term (1-2 years) where the difference between oil and gas will return to historic levels. While LNG capacity expands and shale gas advances, supply will continue to be well above demand. But in the medium term, the horizon is a little more positive.

If there has been something that has been shown in 2010 is that the natural gas market is suffering from less overcapacity than expected. And in the medium term, we can see that uncontracted demand for liquefied natural gas will likely exceed 10BCM in 2013, leaving the market balanced. This does not imply a massive price appreciation given the spare capacity in the system (Russia, Qatar, US-Europe shale), but the market is set to gradually tighten in gas, although at a slower pace than what we have seen in oil. Only a collapse in oil prices from unforeseen excess capacity or a switch in the use of oil for transport to gas could help close the gap.