Over recent weeks,Knight Vinke has suggested that splitting the company into utility gas and traditional oil businesses would unlock significant value.
They value ENI between €27.8 and €32.
My biggest discrepancy with them is a) that the issue is not the Gas & Power business but the E&P, and b) I find it hard to believe that both parts would trade at top-of-subsector multiples if separate.
First in the Snam and Gas & Power business… They take the assumption of Snam trading at a 20% premium to RAB, which is crazy compared to other utility stocks. They also use the rest of the gas & power division at a 30% premium to Enel, Edison, Hera, Acea (which all trade at 5.6-6x EBITDA 1yr fwd). They totally disregard the constant process of de-rating of the Italian utilities in the past six years and the impact on power prices of stalled demand and excessive capacity from gas oversupply.
The refining business is put at Neste multiples, which is OK to me
Chemicals are valued at much higher than anyone can imagine (7.5x EBITDA)
Corporate charges are drastically reduced (probably as part o the assumption that, as separate entities, cost savings and job cuts would happen). This is difficult to believe in Italy, but can be acceptable as a thesis.
Then Knight Vinke value the E&P business at the multiples of a BG, which is too radical given the poor growth, high capex and returns.
In essence they use consensus Sum of the Parts, reduce the traditional Megacap oil discount (21% to 15%) to zero by cutting corporate charges and others, pumping up the valuation of the Italian G&P to multiples of non-Italian (and therefore more attractive) utilities and applying a premium to the Snam RAB that it has never enjoyed in the past (Snam is a mature asset and growth RAB is very limited versus maintenance RAB, something that KV seem to value in the same way).
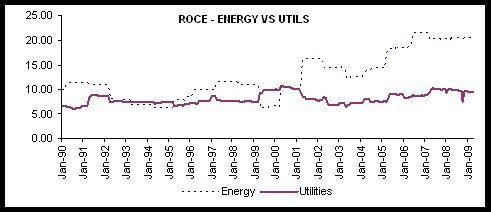
The key, as some analysts (e.g Nomura) point out is that where Eni trades (a 40% discount to its invested capital) is no different to that of other large-cap oils (BP, RDS, FP and STL). I think the value argument can be applied equally to all these companies, but unlocking it is not about addressing a small part (Gas & Power is only 15% of Eni’s invested capital base) but about turning around the core E&P businesses where returns have fallen a staggering 400-500 basis points in four years (while oil prices rose).
That is why, even if separated, it is an illusion to believe that oil investors would see ENI as a high multiple E&P and see it trade at the same multiples as Tullow, Dana, etc… First, because it would still be a State owned entity and its resource base would still be heavily impacted by resource nationalism, low returns and OPEC quotas.
In the meantime, the bet on the stock from here is a full break up not only of the utility assets (which as Scaroni has said, would be regulaywise impossible) but also the disposal (at current market price, no discount) of the Saipem stake.