Tag Archives: Commodities

China Energy Demand Stalls

China oil demand growth disappointed in May, with apparent demand contracting 1% year-on-year.

Consensus estimates +3-4% year-on-year oil demand growth forecast this year, which now needs to average c6% y/y growth from June onwards to be reached.

Natural gas supply growth recovered in May to +15% y-o-y after a disappointing 3% y-o-y growth in April. Imported gas remains c33% of China’s total supply

Thermal coal imports fell sharply in May, down -19% month-on-month seasonally adjusted and -20% y-o-y. The decline has been driven by declining thermal power generation due to broadly flat overall demand and improved hydro and renewables generation.

Fuel oil net imports (graph attached) fell to the second lowest on record for May and kerosene net exports reached a new high for the year. Apparent demand for fuel oil was extremely weak in May, down -32% y-o-y as industrial demand remains weak.

Agricultural imports fell steeply in May, most notably wheat and sugar – each down nearly 40% month-on-month seasonally adjusted. Better rainfall early in the year may lead to improved domestic harvests for a number of crops, reducing appetite for imports later in the year.

In aluminum I still see accelerating capacity addition.

At the higher end of the cost curve, Chalco Guizhou, Zhunyi, Yulong plan to restart 330kt old capacity after the local government granted a RMB12cent/kwh tariff subsidy. Gansu Hualu will restart 50kt old capacity. Baotou aluminum will start 150kt new capacity with captive power plant. Zhongfu has been granted RMB4cent/kwh on the power grid pass-through fee.

At the lower end of the cost curve, Shenhuo will complete the second 400kt capacity in Xinjiang. East Hope, Tianshan and Xinfa will complete 350kt, 500kt and 550kt additional capacity in 2H14.


Important Disclaimer: All of Daniel Lacalle’s views expressed in his books and this blog are strictly personal and should not be taken as buy or sell recommendations.

Chinese Imports discrepancy impacts commodities

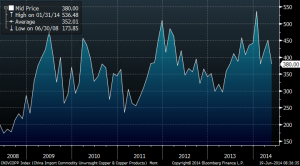
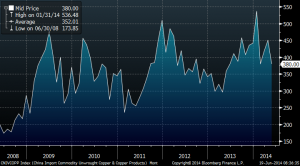
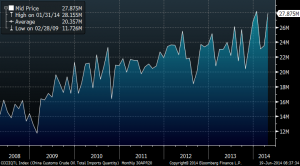
The discrepancy between Chinese imports continues to drive commodities. As seen below, Chinese copper and coal imports remain weak and trending down while oil imports are rising (see graphs below). Copper is down 1.8% MTD and 9.2% YTD, maybe as a vengeance against Chile for obliterating Spain mercilessly in the World Cup.

chinese copper imports

Oil continues to strengthen with Brent  at $114.074/bbl and WTI at $106.51/bbl despite yesterday’s bearish DOE data. Crude drew 0.58 m Bbls vs. expectations for a 0.58 m Bbl draw. Cushing crude inventories built 0.25 m Bbls on the week and now stand at 21.4 m Bbls.  Gasoline built 0.79 m Bbls vs. expectations for a 0.39 m Bbl draw and distillates built 0.44 m Bbls vs. expectations for a 0.04 m Bbl draw. All products drew 0.35 m Bbls. Refinery utilization was down 0.8% vs. expectations for a 0.7% increase. Refinery utilization stands at 87.1% vs. a 5-year average of 88.2%.

Iraq update: The head of Iraq’s state-run South Oil Company Dhiya Jaffar said on Wednesday that Exxon has carried out a “major evacuation” of their staff and BP had evacuated 20% of its staff. He said ENI, Schlumberger, Weatherford, and Baker Hughes had no plans to evacuate staff from Iraq following the lightning advance of Sunni militants through the country. (Reuters) Comments that the refinery in Baiji had fallen to attackers from the Islamic State in Iraq and Syria have been denied by the Malaki government.

Chinese oil imports have strengthened, driving the products market tighter and Tapis to $118.16/bbl, a premium over Brent.

chinese oil imports

Coal continues to weaken to $79.80/mt driven by weak Chinese imports (see graph below).

chinese coal imports

US gas remains well supported at $4.56/mmbtu. Consensus estimates a 112-Bcf inventory build this week vs. a build of 107-Bcf last week and a build of 91-Bcf last year at this time. Gas demand likely has decreased by 1.8-Bcf/d w/w, mainly driven by a 1.6-Bcf/d drop in power sector consumption.

UK gas continues to weaken, at 40 p/th, down 3.97% this month despite the Ukraine crisis, as Gazprom has reassured European markets will continue to be well supplied, Statoil has promised to increase exports if needed and inventories remain in the upper level of the 5 year average. Recent weak gas production from Norway (down 9% year on year) shows that Europe has not needed to increase its imports and demand remains weak.

Spanish power prices rise 89bps driven by low hydro production and extremely hot weather. Spanish power prices are the best performers this year of all continental power prices, with France down 5.86% YTD, Germany down 5.6% YTD, Nordpool down 9.6%, UK down 16.9% and Spain only down 1.2%


Important Disclaimer: All of Daniel Lacalle’s views expressed in his books and this blog are strictly personal and should not be taken as buy or sell recommendations

Iraq and Ukraine move the commodities market

Geopolitical black swans are impacting commodities this morning, with Iraq conflict worsening and Russia threat of cutting supplies to Ukraine.

Brent is at $113.02/bbl and WTI at $107.32/bbl driven by concerns about Iraq. Markets are reacting well as the physical market is not affected so far but concerns are justified.

Iraq produces 3.5mbpd, or 4% of global production and is seen as a key source of future supply growth. Production is mostly in the fields in the South, so far unaffected by the latest attacks, concentrated in the North, according to JP Morgan.

So far the physical market has not seen a relevant disruption, but markets will remain nervous as long as Malaki continues to lose the grip of the key cities, and the terrorists get close to Baghdad.  Expect oil to move closer to $115/bbl Brent as the market analyses the risk of losing exportable production.

The Islamic State in Iraq and the Levant (ISIL) have seized the city of Tal Afar in Northwestern Iraq yesterday but have not continued to advance to Baghdad, so far only concentrating on northern Iraq. The rebels have control of Mosul, the second largest city in Iraq, along with Tikrit and the small towns of Dhiluiya and Yathrib, north of Baghdad. Iraq’s military spokesman Qassim Ata yesterday said that the Iraq army had killed more than 279 members of the rebel group. President Obama has indicated that he is reviewing military options to help Iraq in fighting the rebel groups.

Kurdistan PM is mentioning in the BBC the possibility of splitting Iraq into three separate regions.

The Kurdistan Regional Government has taken over security of the giant Kirkuk field (260k b/d of production) in the North Remaining oil production in the northern oil fields is another 435k b/d. Iraq has the 5th largest proven oil reserves & is the 2nd largest crude producer in OPEC, behind Saudi Arabia, at 3.5 mbpd. OECD oil inventories were 2,624mb at end April, 77mb lower than the 5-yr average & 53mb lower than last year.

My thoughts:

– The US is unable to get involved in a war. The fact that the US will likely be oil independent (including Canada) in 2016 gives little incentive to take action.

– There is very little real western support for Malaki and the country is currently too corrupt so there is risk of a bad public image and lack of popular support problem.

– Oil companies in the South have very strong armies and security is very tight. I see low risk of oil supply disruptions and the ports are working adequately.

– The three large oil companies must have anticipated these issues as they shipped most of their needed equipment last year. They also doubled security.

– Low probability of the ISIS reaching Baghdad but strong probability of a country that ends up broken in three (Kurdistan, a Sunni North capital Tikrit and a Shiia South capital Baghdad).

Helping reduce the geopolitical risk on oil is the FT reporting that US liquids production hit 11.27 mbpd in April, and is today above its previous peak in 1970 of 11.3 mbpd. With a higher percentage of NGLs, still crude production was 8.3 mbpd in April (now 8.5m), lower than the record high of 10 mbpd in November 1970.

UK gas rises +7.1% at 45p/therm and European gas seems to rise in sympathy as Gazprom threatens to cut supply to Ukraine after the deadline to pay the outstanding bill of $2bn passed with no agreement on  a timetable of payment or price. The Ukraine government is mentioning that the price has to be revised to international levels and that they cannot pay this figure or the revised price of $8.5/mmbtu. The EU is looking for an option that includes a revision of the price for a long term contract and gradual payments. Gazprom will cut off supplies unless Ukraine pays for the gas up front.

Gazprom however, will not disrupt supplies to Europe. 33% of Europe’s gas comes from Gazprom and 50% of it is transported through Ukraine. Ukraine has enough gas in storage (13bcm) to hold on to summer demand as its annual consumption is 33bcm according to UBS. Europe also has a record amount of gas in storage after a very warm winter.

Europe’s largest gas supplier after Gazprom is Statoil who mentions it can “easily” offset any short-term disruption of Russian supply.

 Coal remains weak at $80.40/mt holding on to its support level despite news that freight rates for panamax dry bulk vessels are now below opex, and long-term forward rates have fallen below break-even. Chinese coal import is the most important trade for panamaxes and chinese imports of thermal coal are expected to be lower in 2014 than in 2013. Capesize rates have come down 43% YTD and forward rates for Q4 fell 4% this Friday.Adding to this a 100 milion tonnes of Australian capacity growth, the outlook for both coal prices and the Baltic Dry is not positive. Freight companies are growing the fleet by 4% this year so oversupply is even higher.

The Baltic Dry index is down 3% this month (-60% YTD) driven by oversupply of reights and weakening Chinese imports.

 CO2 rises 53bps at €5.74/mt helped by backloading efforts to reduce the impact on CO2 prices of lower industrial demand and poor thermal output.

US gas rises 65bps at $4.67/mmbtu helped by the past six weeks injection data. It would require a very aggressive change in injection data in the next months to justify prices below $4/mmbtu… I believe we are going to see $5/mmbtu sooner rather than later. Weekly natural gas storage injection of 107 Bcf way below the consensus median injection estimate of 112 Bcf and the bears’ view of 161bcf. Total working storage is now at 1,606 Bcf, 727 Bcf below last year’s level and 877 Bcf below the 5-year average of 2,483 Bcf.

Power prices in Europe are reacting mildly… Germany at €34.70/mwh (-5.35% YTD), Nordpool at €30.78/mwh (-4% YTD). Spanish power prices are down 1.2% YTD and French -5.5% YTD.


Important Disclaimer: All of Daniel Lacalle’s views expressed in his books and this blog are strictly personal and should not be taken as buy or sell recommendations
Nickel prices soar with Indonesia ban and Russia sanctions risk

nickel

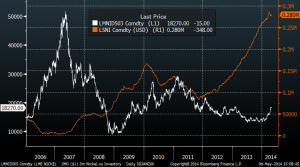
Nickel prices are up 33% YTD following the introduction of a ban on ore exports from Indonesia in early January.

This ban is unlikely to be lifted until 2015, according to analysts. However, the higher the Nickel price, the more likely it is to see it lifted. According to David Wilson at Citigroup “removing the Indonesian flow would be similar to removing Saudi Arabia from the oil market”.

The top nickel producers are Philippines and Indonesia both at c440,000 mt, followed by Russia.

The Ukraine crisis impacts the third largets nickel producer, Russia. Within Russia, Norilsk Nickel is “the single-largest producer of the metal, and group production of 285,000 tonnes last year accounted for more than 15% of the global total”, according to The Wall Street Journal. Therefore, the risk of sanctions on this company alone would shift the supply-demand dynamics of the market rapidly.

Although supply from Russia has not been cut, it poses new risks on a market where demand is not strong, but supply cuts can rapidly move to create a very tight situation.

Nickel demand has been poor in recent years -virtually flat, +0.6% pa 2003-2009, and up small between 2009 and 2013. Last year, stainless steel output rose 3.5%, helping improve the picture.

Growth in demand remains fully dependent on China. An expected 4.9% to 2020 pa growth is supported exclusively by Asia and considering the current revisions of Chinese GDP from +8.2% to +7.4% by the OECD, this demand growth is likely to be brought down.

Inventories, as the graph shows, have not moved drastically despite the massive price increase, which means that the physical market is comfortable despite the Indonesia ban. At the end of March 2014, China had over 20Mt of nickel ore stockpiled.

Many traders see the current $18k Nickel price as temporary because once prices increase dramatically Indonesia would lift the ban to benefit from better prices. However, the market can move from a 140kt global surplus in 2013 to a balanced market, or even a deficit in 2014. Indonesia alone moves this deficit one way or the other, but the combination of Russian sanctions risk and the Indonesia ban makes the balance extremely fragile.