Tag Archives: Energy

Iraq and Ukraine move the commodities market

Geopolitical black swans are impacting commodities this morning, with Iraq conflict worsening and Russia threat of cutting supplies to Ukraine.

Brent is at $113.02/bbl and WTI at $107.32/bbl driven by concerns about Iraq. Markets are reacting well as the physical market is not affected so far but concerns are justified.

Iraq produces 3.5mbpd, or 4% of global production and is seen as a key source of future supply growth. Production is mostly in the fields in the South, so far unaffected by the latest attacks, concentrated in the North, according to JP Morgan.

So far the physical market has not seen a relevant disruption, but markets will remain nervous as long as Malaki continues to lose the grip of the key cities, and the terrorists get close to Baghdad.  Expect oil to move closer to $115/bbl Brent as the market analyses the risk of losing exportable production.

The Islamic State in Iraq and the Levant (ISIL) have seized the city of Tal Afar in Northwestern Iraq yesterday but have not continued to advance to Baghdad, so far only concentrating on northern Iraq. The rebels have control of Mosul, the second largest city in Iraq, along with Tikrit and the small towns of Dhiluiya and Yathrib, north of Baghdad. Iraq’s military spokesman Qassim Ata yesterday said that the Iraq army had killed more than 279 members of the rebel group. President Obama has indicated that he is reviewing military options to help Iraq in fighting the rebel groups.

Kurdistan PM is mentioning in the BBC the possibility of splitting Iraq into three separate regions.

The Kurdistan Regional Government has taken over security of the giant Kirkuk field (260k b/d of production) in the North Remaining oil production in the northern oil fields is another 435k b/d. Iraq has the 5th largest proven oil reserves & is the 2nd largest crude producer in OPEC, behind Saudi Arabia, at 3.5 mbpd. OECD oil inventories were 2,624mb at end April, 77mb lower than the 5-yr average & 53mb lower than last year.

My thoughts:

– The US is unable to get involved in a war. The fact that the US will likely be oil independent (including Canada) in 2016 gives little incentive to take action.

– There is very little real western support for Malaki and the country is currently too corrupt so there is risk of a bad public image and lack of popular support problem.

– Oil companies in the South have very strong armies and security is very tight. I see low risk of oil supply disruptions and the ports are working adequately.

– The three large oil companies must have anticipated these issues as they shipped most of their needed equipment last year. They also doubled security.

– Low probability of the ISIS reaching Baghdad but strong probability of a country that ends up broken in three (Kurdistan, a Sunni North capital Tikrit and a Shiia South capital Baghdad).

Helping reduce the geopolitical risk on oil is the FT reporting that US liquids production hit 11.27 mbpd in April, and is today above its previous peak in 1970 of 11.3 mbpd. With a higher percentage of NGLs, still crude production was 8.3 mbpd in April (now 8.5m), lower than the record high of 10 mbpd in November 1970.

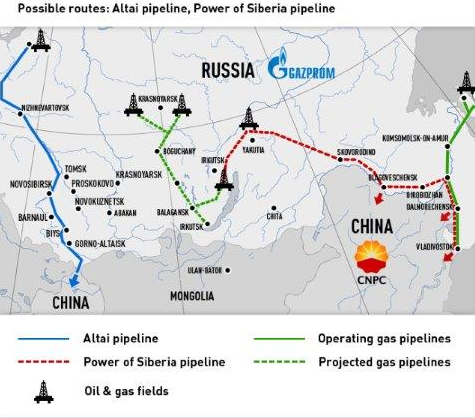
UK gas rises +7.1% at 45p/therm and European gas seems to rise in sympathy as Gazprom threatens to cut supply to Ukraine after the deadline to pay the outstanding bill of $2bn passed with no agreement on  a timetable of payment or price. The Ukraine government is mentioning that the price has to be revised to international levels and that they cannot pay this figure or the revised price of $8.5/mmbtu. The EU is looking for an option that includes a revision of the price for a long term contract and gradual payments. Gazprom will cut off supplies unless Ukraine pays for the gas up front.

Gazprom however, will not disrupt supplies to Europe. 33% of Europe’s gas comes from Gazprom and 50% of it is transported through Ukraine. Ukraine has enough gas in storage (13bcm) to hold on to summer demand as its annual consumption is 33bcm according to UBS. Europe also has a record amount of gas in storage after a very warm winter.

Europe’s largest gas supplier after Gazprom is Statoil who mentions it can “easily” offset any short-term disruption of Russian supply.

 Coal remains weak at $80.40/mt holding on to its support level despite news that freight rates for panamax dry bulk vessels are now below opex, and long-term forward rates have fallen below break-even. Chinese coal import is the most important trade for panamaxes and chinese imports of thermal coal are expected to be lower in 2014 than in 2013. Capesize rates have come down 43% YTD and forward rates for Q4 fell 4% this Friday.Adding to this a 100 milion tonnes of Australian capacity growth, the outlook for both coal prices and the Baltic Dry is not positive. Freight companies are growing the fleet by 4% this year so oversupply is even higher.

The Baltic Dry index is down 3% this month (-60% YTD) driven by oversupply of reights and weakening Chinese imports.

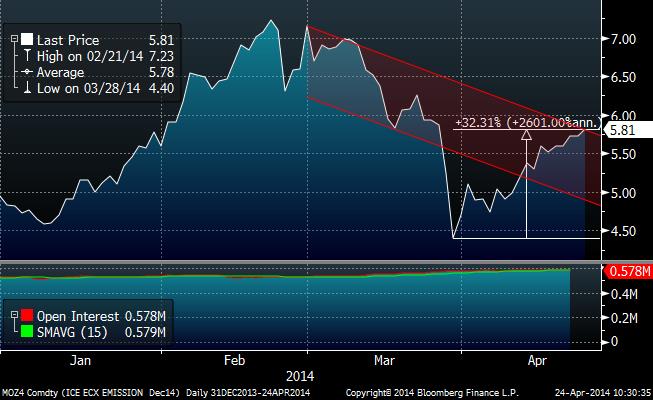
 CO2 rises 53bps at €5.74/mt helped by backloading efforts to reduce the impact on CO2 prices of lower industrial demand and poor thermal output.

US gas rises 65bps at $4.67/mmbtu helped by the past six weeks injection data. It would require a very aggressive change in injection data in the next months to justify prices below $4/mmbtu… I believe we are going to see $5/mmbtu sooner rather than later. Weekly natural gas storage injection of 107 Bcf way below the consensus median injection estimate of 112 Bcf and the bears’ view of 161bcf. Total working storage is now at 1,606 Bcf, 727 Bcf below last year’s level and 877 Bcf below the 5-year average of 2,483 Bcf.

Power prices in Europe are reacting mildly… Germany at €34.70/mwh (-5.35% YTD), Nordpool at €30.78/mwh (-4% YTD). Spanish power prices are down 1.2% YTD and French -5.5% YTD.


Important Disclaimer: All of Daniel Lacalle’s views expressed in his books and this blog are strictly personal and should not be taken as buy or sell recommendations

Gazprom-CNPC deal

Gazprom dealMap courtesy of Gazprom

Conditions:

30 year agreement to start in 2018

38bcm of Russian gas to be delivered to China annually (25% of Chinese demand)

Price: Estimated $350-400/mcm. The formula pricing (oil and a basket of oil products)

Capital Expenditure: $75bn (China’s share $20bn) – includes development of Chayanda and Kovykta fields; and construction of a 2,500-mile pipeline, a petrochemicals complex and a helium plant

Prepayment: $25bn (yet to be confirmed)

The estimated price of the Russia-China contract is $9.75/mmbtu (only $0.95/mmbtu higher than long term Europe contracts). This means that E.On, RWE and GSZ will find it difficult to lower their gas price-offtake agreements in the negotiations of their contracts with Gazprom.

The two sides were not actually negotiating a specific price per unit of gas, but rather a ratio of gas to oil prices. The numbers above likely assume prevailing oil prices, and actual realized prices over the course of the contract could vary significantly depending upon oil markets (according to Citi).

The contract signed targets a nominal volume of 38bcm. However, volumes could be expanded to 60bcmpa later on

Citi estimate the IRR of the project at 4.4% on an ungeared basis and 4.8% assuming 50% project gearing, lower than either Gazprom or Petrochina’s cost of capital, thus generating a negative NPV.

Important Disclaimer: All of Daniel Lacalle’s views expressed in his books and this blog are strictly personal and should not be taken as buy or sell recommendations

CO2 … recovery or dead cat bounce?

CO2 recovery

Carbon has seen a decent bounce after the collapse back to €5.80/mt (albeit nowhere close to the highs of €20/mt seen a few years ago). Carbon is trying to climb back after the recent sharp correction. I commented a few reasons for the fall in prices here.  Now to the recovery…

What is driving prices higher?

. Kickstart of the carbon backloading plan, which sets aside 900m carbon certificates on a temporary basis. Backloading is implemented in 2Q 2014 after a 3-month scrutiny period and lasts until 2016. However, the 900 m certificates will be re-injected in 2019-20 again, so the oversupply is not addressed unless we see massive increase in thermal demand, which is unlikely given oversupply in generation and renewables rollout. As UBS points out “9GW of new efficient coal plants with marginal cost not higher than €30/MWh will enter the system by 2015, with a negative effect on dark spreads. In combination with declining power demand and renewables capacity growth (5 GW), we see little reason for a bullish view on generators”.

Market is very oversupplied, but the implementation of backloading has already started. So what we are seeing is a liquidity driven squeeze, not a fundamental shift in supply-demand. The most optimistic scenarios from analyst estimates see oversupply lasting until 2030 (UBS sees 2032).

Oversupply of EUAs has gone from 500 million metric tonnes in 2010 to 900 million metric tonnes in 2014 and despite backloading it is expected to double by 2020.

Mr Bostjan Bandelj a director at Belektron in Ljubljana said on Reuters that “Even as backloading seems a done deal, prices are under pressure from government auctions and sales of allowances from a special reserve by the European Investment Bank in the next months.”


The Chinese Slowdown Impact On Commodities

China slowdown 1

29/03/14 Confidential

“China’s economic restructuring has made pre-2008 paradigms out of date and off the mark” Hanfeng Wang

I have had the pleasure of giving a masters degree on commodities at UNED, and talking to my students I was always surprised at how easily they assumed as unquestionable the expected consumption figures from China. And there is a lot to question.

When we talk about the slowdown in China some assume a total collapse. And it is not. But it’s the end of a model of aggressive debt and building “anything” to “grow”. Excessive and unproductive debt. According to Morgan Stanley the country today needs four times more debt to create an additional unit of gross domestic product compared to only five years ago.

Changing the model to a more sustainable and consumer-oriented one is not bad.

– 41% of Chinese investments flow to the consumer sector and services, compared to less than 30% a few years ago.

– The economy is being modernized: Imports of high-tech products have been reduced from 85% of the total to 71%.

– Exports of high added value goods grew 50% from five years ago to 85.4%. Incidentally, this is something that terrifies the Japanese and their “monetary imperialism” as some Asian commentators call it (https://www.dlacalle.com/abenomics-failure-in-six-charts/).

The Chinese economy is increasingly less industry and more services. Because the model was not sustainable. Gone are the steel mills that manufactured and then re-melted end product, the ghost towns and 28 million unsold homes … and the rows of windmills and solar panels without connection to the grid. Anyone who’s ever seen them never forgets them.

No one can consider the change as negative. South Korea and Taiwan held that transition without a problem, they just had to adapt to GDP growths of +2 – +4%. However, since Chinese excess debt is huge, especially in SOEs, the process is not so simple. Because the economy saves less (falling three percentage points since 2010) and borrows more.

The fact that much of this debt is financed internally by local banks does not mitigate the risk. A pyramid scheme doesn’t stop being one just because participants lend to each other.

A 200% debt to GDP when 48% of companies in the Hang Seng, especially semi-state owned do not generate returns above cost of capital is a huge problem. It has a large impact on the financing capacity of the productive sectors, as mentioned in the CICC report “A Tale of Two Economies”.

However, the slowdown of the “old Chinese economy” is not cyclical. It is structural. And it has a huge impact on the commodities market. We are seeing a very significant impact on the demand for coal, copper, iron ore and oil, creating an overcapacity that depresses prices in the medium and long term. Something that benefits other importing countries.

Producers of commodities had become accustomed to an ever increasing demand driven by China and now face the excess supply. Those producers, especially in iron ore, coal and copper, always try to replace lost revenues by producing more, thinking that in a not-too-distant future the demand slowdown will reverse. A serious mistake.

The impact of the “Chinese slowdown” in oil, copper, coal and iron ore is a much more reliable indicator of growth in industrial activity than GDP.

Let’s start with something crucial. We should not ignore the “inventory” effect. A huge amount of Chinese purchases  are not consumed, just stored. Unadjusted estimates of demand have been lethal for many producers. Inventories of iron ore for example, have risen by 57% between 2013 and 2014. And for coal and petroleum products inventories are at peak levels of 2010.

– In oil, OPEC members are already considering to reducing exports by one million barrels a day. China consumes nearly 10% of the world’s oil and means almost one third of oil exports. However, Chinese demand in January and February fell 1.9%. In the early months of 2014, adjusted for inventories (ie, removing what you buy to store) demand fell by 4.6% over the same period in 2013. Chinese demand expectations are wrongly based on the country reaching a per capita consumption similar to the U.S. or the OECD and, as always, they forget efficiency and substitution. Believe what you believe, but distrust those optimistic estimates that are reduced by 30-35% each year.

– In iron ore, China represents 63% of global exports. Analysts from UBS to Standard Chartered, warn of the difficulty for the country to meet its demand growth estimates of 3% annually, leading to an oversupply in 2014 reaching 136 million tons, 170 million in 2015. As an example of the “Chinese slowdown”, in 2012 there was a shortfall of iron ore of 70 million tonnes. In a few months it turnmed to a similar level of surplus. Chinese steel consumption has stagnated below 60 million tonnes per month since December 2012 ( https://www.dlacalle.com/iron-ore-more-oversupply-more-china-worries/ ).

– In coal, China accounts for almost 50% of world coal consumption. With a government program seeking to reduce pollution, growth expectations of Chinese demand do not exceed 1.6% per annum. That is, it is very likely that imports will not exceed 220 million tons. With growth of global production and exports from Australia, South Africa and Colombia, the world faces another year of excess supply of more than 20% ( http://www.reuters.com/article/2013/05/09/ energy-coal-idUSL6N0DQ0UU20130509 ).

– In copper, the problem is the same. Increasing supply, decreasing demand from the main consumer, China, which accounts for 39% of the global market. The estimated surplus of refined copper was revised up from 327,000 in 2014 to 369,000 metric tons, and in 2015 is expected to exceed 400,000 .

We should be very careful to ignore the effects of overcapacity when exporting countries are looking to offset lost revenues with more production, and let us not forget the depressing effect of excess storage. Because it’s a lethal combination in the world of commodities.

Ignoring the elephant in the room is one of the biggest mistakes we make when making estimates for the future. We take exceptional periods, access to credit, liquidity, consumption or growth, as new paradigms that will perpetuate forever. We do not question whether it is sustainable or not. Or worse, when it is perceived as excessive, we tend to justify it.

In the analysis of commodities the mistake is even greater because it is applied to the largest consumer in the world: China. And when economists make a mistake up to 40% in their estimates for three consecutive years but 2020 expectations remain unchanged, the problem is magnified.

Bulls already know the arguments … “Chinese demand will be multiplied by two in the next twenty years” etc.. In 2012 a friend at Exxon said to me about the Chinese growth. “I do not believe it. And those who plan using the official estimates of growth in China as a reference can only be disappointed. ”

For the commodities market, and for all, the change in the Chinese model is a positive because it was unsustainable. But let’s not ignore the wave effects it can have on a world hooked to China’s perennial growth.

Of course, many will say that everything I say is irrelevant, because China, as any good communist dictatorship, grows and consumes whatever the Communist Party decides. Yep, but the argument works both ways. If the Party decides to change the model, it will change it.

In any case, an economic model is no less unsustainable because the ruling party dictates it. It falls under its own weight sooner or later. And with a little luck, it takes the ruling party down with it.

– See more at: https://www.dlacalle.com/el-frenazo-chino-ataca-a-las-materias-primas/#sthash.yEd2qI6B.dpuf