Tag Archives: Commodities

CO2 collapses 41% MTD

CO2 2014

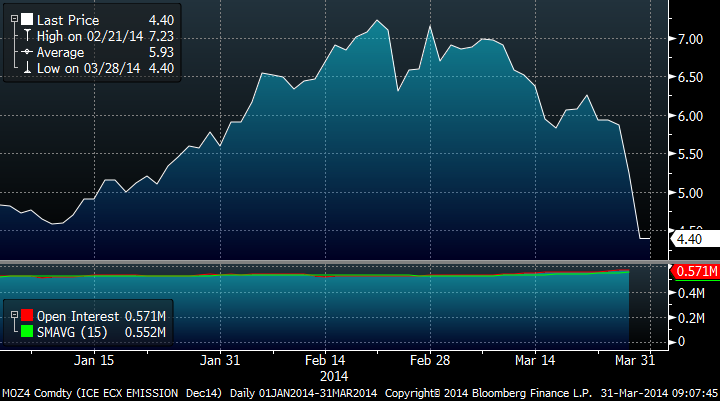
CO2 continues to collapse (-41.8% MTD, -16% YTD) after the EU intervention has failed to address the massive oversupply of free credits  and demand continues to fall.  CO2 trades at €4.5/mt (31st March 2014). It traded as high as €35/mt in 2008. -87.7% from the peak, or a massive -30.7% per annum for a “politically designed” commodity created to desincentivize CO2 emissions.

Same story over and over: Oversupply meets falling demand:

–  Oversupply: The market reserve mechanism was introduced by the EU because even once CO2 backloading is applied, the oversupply of CO2 in the EU ETS will trough at around 1.5bn credits. The reserve mechanism will be used when the total number of allowances in circulation, defined for a single year as all the allowances and international credits issued from 2008 to that year, less the total emissions produced and any already in the reserve (basically the oversupply of the system) is above a certain level. This means that oversupply of emission rights in any given year will continue to be around 2bn tons of CO2 to 2020 in the most optimistic scenario. The supply of CO2 (EUAs) has exceeded demand by at least 20m Mtons almost every month since 2010. 

– Demand down: In the EU, 2013 verified emissions for the EU-ETS will be 3.8% lower yoy, and will reach 1.79bn tCO2, while ETS demand for 2014 is expected to fall another 3%. 

According to SocGen, CO2 emissions for the largest four sectors in the EU-ETS comprise nearly 95% of all emissions, historically. Combustion installations are by far the largest contributor, emitting over 70% of all CO2 in Europe. Verified emissions for combustion installations in 2012 were 11% lower than their 2007 peak, mirroring similar decreases in electricity consumption across Europe. Emissions from energy-intensive industries, like mineral oil refineries, pig iron/steel, and cement clinker/lime production have essentially stagnated since 2009, after a material drop coinciding with the beginning of the recession.

The European Union is 30% of the emissions of the world, but (hold on) 100% of the cost as no other country has adhered to emission trading schemes. Therefore, a slowdown in industrial production and a debt crisis that could delay the extremely aggressive and optimistic plans for a low carbon economy announced for 2030, added to the slow but sure slowdown in power demand is proving that a system that was artificially created is causing the demise of a government-forced scheme that ultimately was only a tax.

CO2 (as I mentioned in 2009) is a “fake commodity” artificially invented, where demand and supply are imposed by political entities… and it still does not work. Neither the Copenhagen, or Cancun summits, or the efforts of several investment banks and environmentalists have helped to raise the price. Interventionists were rubbing their hands at the prospect of increasing the price of CO2 through more than questionable environmental policies, and now they need to find inflation through imposition.

Unless we see a much more drastic approach from the EU to address the oversupply of EUAs the picture is not positive. But at the same time, a drastic approach attacks the economic recovery and adds a burden to industries all over Europe, so I would not count on it. According to Citi it would require a 14% increase in power and industrial demand to start to address the oversupply of EUAs.

In summary, lower industrial demand is driving emissions lower, and a miscalculated free rights scheme continues to show a massive oversupply.

See more at: https://www.dlacalle.com/why-co2-collapsed-20-in-two-days/

Further read: https://www.dlacalle.com/co2-collapses-to-all-time-low/


Energy Commodities see No Price Inflation from Ukraine-Crimea

Crisis? What Crisis? The Ukraine-Crimea conflict has to be the most uneventful geopolitical event solely judging by commodities price impact. Energy commodities are showing no price inflation from the Ukraine conflict as China slowdown is more relevant

Brent continues to shrug off any Crimea-Libya concerns and is down 0.8% MTD as the Chinese slowdown is vastly more important.

Russia is going to ship 88 cargoes of Urals crude from Primorsk, UST-Luga and Novorossiysk, highlighting there is no disruption to oil moves.

Spain could replace 10% of Russian gas exports to EU according to Platts. It would be achieved by boosting pipeline gas from Morocco and Algeria, fully utilizing its six regasification terminals to bring LNG and developing its own shale gas resources. However, the EU would pay 50% more if it replaced Russian gas with LNG, Norwegian gas and coal, and 80% more if it did so with renewables, according to Bloomberg and CERA.

China apparent oil demand in January-February fell 1.9% y-o-y, as the Chinese economy weakened. As a result of the shift of Chinese New Year from January in 2013 to February in 2014, apparent oil product demand fell -6.5% in January and rose 3.1% in February. In 2M14, inventory-adjusted demand slid 4.6% y-o-y.

According to Reuters, Libya’s national oil company said on Thursday that protesters had blocked the condensate pipeline linking the al-Wafa field to the Mellitah export complex. The gas pipeline is believed to be still operating. The protesters are reportedly threatening to stop exports from the Mellitah complex which is operated by ENI and NOC.

Coal is flat (-25bps MTD) at $80.50/mt. China announced a new plan to cut coal’s share of energy use to 65.0% in 20141, down from 65.7% in 2013, in a bid to improve air quality in major cities. With total energy consumption growth targeted at 3.2%, coal consumption would rise by just 1.6% this year while supply is expect to grow 3%.

CO2 is seeing another leg down, -28% MTD and moving close to flat on the year (+4.6% YTD), losing almost all the gains seen in the first months from backloading messages from the EU that do not address the chronic oversupply of more than 9 bn mt.

US gas is flat MTD at 4.6/mmbtu after Natural gas storage withdrawal was 57 Bcf. Natural gas storage is now at 896 Bcf, the lowest level since 2003. I expect there to be at least one more storage withdrawal (next week) before the injection season starts. Storage set to peak around 3,625 Bcf, which is approximately 225 Bcf below the 5-year average.

According to LNG World News, the Canadian government has authorised four proposed terminals on the country’s west coast to export LNG. The ministry of natural resources awarded the licences to Pacific Northwest LNG, Prince Rupert LNG, WCC LNG and Woodfibre LNG. Shipments from Canada’s British Columbia province can arrive in Asian ports in just 11 days, or nearly a month sooner than those from the US Gulf coast. All told, these long-term licences allow the four terminals to export up to 73.38m tonnes of LNG per year.

UK gas (NBP) continues to slide, down 8.8% MTD proving Ukraine is no real concern. European gas prices have not moved either, as inventories continue to be well above the 5 year average.

Power prices in Europe decline further: UK at 51.40£/mwh (-2% MTD), Germany at €34.55/mwh (-4% MTD) and Nordpool at €30/mwh (-2.9% MTD).

Iron Ore… More Oversupply… More China worries

Iron Ore correction


Same as with copper. China slowdown means trouble for iron ore. More supply and less demand.

China is the world’s biggest buyer of iron ore, accounting for 63% of global imports last year. China will import a total of 872 million tons in 2014, and 916 million tons in 2015 according to official Chinese estimates. However, this figure is likely to be revised down. The country’s crude-steel production may total 802 million tons this year, from 803 million tons estimated in December, and increase to 819 million tons in 2015. This improvement doesn’t reduce the oversupply. Macquarie’s China steel survey also highlights disappointing demand indicators after Chinese New Year.

UBS points out a downside risk to 3% China’s steel growth outlook. Added to this the China credit concerns and the fact that Chinese port inventories are up 57% year-on-year adds to a concerning outlook for demand. As I wrote here months ago… Careful with China.

Moving to the supply side, the fact that producers are happy to increase output even if prices fall to $70 (breakeven) means that large iron ore producers like Rio Tinto Group and BHP Billiton Ltd will not take action to reduce oversupply. According to Macquarie BHP & Rio continue to invest pro-cyclically “whereas we believe it should be the dividend that flexes to reflect business conditions while keeping capex steady through the cycle”. What’s more, recent acquisitions are a reminder that both have been poor at picking the cycle historically.

New iron ore supply from Australia may total 92 million tons this year, pressuring prices in the second half, according to Standard Chartered in a Bloomberg news report.

Standard Chartered bank predicts a global surplus of 136 million tons in 2014, increasing to 170 million tons in 2015, from a 77 million ton deficit last year.

I see the same pattern as with crude, coal and copper. Excess supply brought to the system to “accommodate” the “high growth” in Chinese demand is meeting the reality of overly optimistic expectations of Chinese industrial output growth.

When producers overestimate demand from the largest customer by far… Things get nasty.

Remember what I said on copper… domino effect. Good for importers, though :).

Why is Copper collapsing?

Copper  has collapsed -12% so far this year and is trading below 2011 lows. Copper is a risk indicator of the weakening Chinese economy and the slowdown in global industrial production.

Reasons:

– Much of the low-quality loans in China use copper as collateral, up to 30% according to HSBC, as it is an indicator of industrial activity and closely linked to Chinese growth. When the market begins to question the debt repayment capacity of many Chinese companies in difficulties, margin calls are triggered and copper falls with it.

– It’s the most common commodity linked to industrial production. Copper price is a good indicator of the global economy as fluctuations in price are determined by industrial demand.  Given that Chinese demand represents approximately 39% of global copper demand, the slowdown  of its  economy  has a big impact on the price.

It’s a double impact: Financial and demand-led. What was supposed to be a good hedge is actually a double risk on the economic slowdown.

Lower demand, supply rises

The estimated surplus of refined copper was revised up from 327 thousand tons to 369 thousand tons for 2014 and is forecast to exceed 400 thousand tons in 2015.

Chile, China, Brazil, Peru and Mongolia seek to increase production in 2014 and 2015. Global production is expected to grow by 5.2% and 5.5% in 2014 and 2015.

In 2011, Chile accounted for 34% of the world’s copper production, approximately 19% of the revenues for the country. USA is the fourth largest copper producer in the world, after Chile, Peru and China, and Australia is fifth. All these countries aim to increase production and produce more. When prices fall producers seek to increase production to maintain revenues, a typical -and misguided- attitude of pro cyclical commodity producers.

China accounts for 39% of copper demand, followed by Europe 17%, other Asia 15%, U.S. 9%, Japan 5%. The rest are minor consumers.

A moderation in  growth in demand for refined copper in China, from +8.5% to +6.5% for 2014 and 2015, along with the lower European demand, means that overcapacity increases by nearly 81,000 tons annually. China has seen its stockpiles of copper grow by 4.6% to 207,320 tonnes. It is estimated that the total copper stored in China exceeds 725,000 tons.

Demand down, supply up and a financial hedge gone wrong… Domino effect.

Copper