29/03/14 Confidential
“China’s economic restructuring has made pre-2008 paradigms out of date and off the mark” Hanfeng Wang
I have had the pleasure of giving a masters degree on commodities at UNED, and talking to my students I was always surprised at how easily they assumed as unquestionable the expected consumption figures from China. And there is a lot to question.
When we talk about the slowdown in China some assume a total collapse. And it is not. But it’s the end of a model of aggressive debt and building “anything” to “grow”. Excessive and unproductive debt. According to Morgan Stanley the country today needs four times more debt to create an additional unit of gross domestic product compared to only five years ago.
Changing the model to a more sustainable and consumer-oriented one is not bad.
– 41% of Chinese investments flow to the consumer sector and services, compared to less than 30% a few years ago.
– The economy is being modernized: Imports of high-tech products have been reduced from 85% of the total to 71%.
– Exports of high added value goods grew 50% from five years ago to 85.4%. Incidentally, this is something that terrifies the Japanese and their “monetary imperialism” as some Asian commentators call it (https://www.dlacalle.com/abenomics-failure-in-six-charts/).
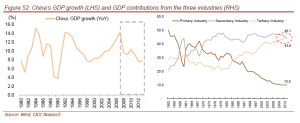
The Chinese economy is increasingly less industry and more services. Because the model was not sustainable. Gone are the steel mills that manufactured and then re-melted end product, the ghost towns and 28 million unsold homes … and the rows of windmills and solar panels without connection to the grid. Anyone who’s ever seen them never forgets them.
No one can consider the change as negative. South Korea and Taiwan held that transition without a problem, they just had to adapt to GDP growths of +2 – +4%. However, since Chinese excess debt is huge, especially in SOEs, the process is not so simple. Because the economy saves less (falling three percentage points since 2010) and borrows more.
The fact that much of this debt is financed internally by local banks does not mitigate the risk. A pyramid scheme doesn’t stop being one just because participants lend to each other.
A 200% debt to GDP when 48% of companies in the Hang Seng, especially semi-state owned do not generate returns above cost of capital is a huge problem. It has a large impact on the financing capacity of the productive sectors, as mentioned in the CICC report “A Tale of Two Economies”.
However, the slowdown of the “old Chinese economy” is not cyclical. It is structural. And it has a huge impact on the commodities market. We are seeing a very significant impact on the demand for coal, copper, iron ore and oil, creating an overcapacity that depresses prices in the medium and long term. Something that benefits other importing countries.
Producers of commodities had become accustomed to an ever increasing demand driven by China and now face the excess supply. Those producers, especially in iron ore, coal and copper, always try to replace lost revenues by producing more, thinking that in a not-too-distant future the demand slowdown will reverse. A serious mistake.
The impact of the “Chinese slowdown” in oil, copper, coal and iron ore is a much more reliable indicator of growth in industrial activity than GDP.
Let’s start with something crucial. We should not ignore the “inventory” effect. A huge amount of Chinese purchases are not consumed, just stored. Unadjusted estimates of demand have been lethal for many producers. Inventories of iron ore for example, have risen by 57% between 2013 and 2014. And for coal and petroleum products inventories are at peak levels of 2010.
– In oil, OPEC members are already considering to reducing exports by one million barrels a day. China consumes nearly 10% of the world’s oil and means almost one third of oil exports. However, Chinese demand in January and February fell 1.9%. In the early months of 2014, adjusted for inventories (ie, removing what you buy to store) demand fell by 4.6% over the same period in 2013. Chinese demand expectations are wrongly based on the country reaching a per capita consumption similar to the U.S. or the OECD and, as always, they forget efficiency and substitution. Believe what you believe, but distrust those optimistic estimates that are reduced by 30-35% each year.
– In iron ore, China represents 63% of global exports. Analysts from UBS to Standard Chartered, warn of the difficulty for the country to meet its demand growth estimates of 3% annually, leading to an oversupply in 2014 reaching 136 million tons, 170 million in 2015. As an example of the “Chinese slowdown”, in 2012 there was a shortfall of iron ore of 70 million tonnes. In a few months it turnmed to a similar level of surplus. Chinese steel consumption has stagnated below 60 million tonnes per month since December 2012 ( https://www.dlacalle.com/iron-ore-more-oversupply-more-china-worries/ ).
– In coal, China accounts for almost 50% of world coal consumption. With a government program seeking to reduce pollution, growth expectations of Chinese demand do not exceed 1.6% per annum. That is, it is very likely that imports will not exceed 220 million tons. With growth of global production and exports from Australia, South Africa and Colombia, the world faces another year of excess supply of more than 20% ( http://www.reuters.com/article/2013/05/09/ energy-coal-idUSL6N0DQ0UU20130509 ).
– In copper, the problem is the same. Increasing supply, decreasing demand from the main consumer, China, which accounts for 39% of the global market. The estimated surplus of refined copper was revised up from 327,000 in 2014 to 369,000 metric tons, and in 2015 is expected to exceed 400,000 .
We should be very careful to ignore the effects of overcapacity when exporting countries are looking to offset lost revenues with more production, and let us not forget the depressing effect of excess storage. Because it’s a lethal combination in the world of commodities.
Ignoring the elephant in the room is one of the biggest mistakes we make when making estimates for the future. We take exceptional periods, access to credit, liquidity, consumption or growth, as new paradigms that will perpetuate forever. We do not question whether it is sustainable or not. Or worse, when it is perceived as excessive, we tend to justify it.
In the analysis of commodities the mistake is even greater because it is applied to the largest consumer in the world: China. And when economists make a mistake up to 40% in their estimates for three consecutive years but 2020 expectations remain unchanged, the problem is magnified.
Bulls already know the arguments … “Chinese demand will be multiplied by two in the next twenty years” etc.. In 2012 a friend at Exxon said to me about the Chinese growth. “I do not believe it. And those who plan using the official estimates of growth in China as a reference can only be disappointed. ”
For the commodities market, and for all, the change in the Chinese model is a positive because it was unsustainable. But let’s not ignore the wave effects it can have on a world hooked to China’s perennial growth.
Of course, many will say that everything I say is irrelevant, because China, as any good communist dictatorship, grows and consumes whatever the Communist Party decides. Yep, but the argument works both ways. If the Party decides to change the model, it will change it.
In any case, an economic model is no less unsustainable because the ruling party dictates it. It falls under its own weight sooner or later. And with a little luck, it takes the ruling party down with it.
– See more at: https://www.dlacalle.com/el-frenazo-chino-ataca-a-las-materias-primas/#sthash.yEd2qI6B.dpuf
 Map courtesy of Gazprom