All posts by Daniel Lacalle

About Daniel Lacalle

Daniel Lacalle (Madrid, 1967). PhD Economist and Fund Manager. Author of bestsellers "Life In The Financial Markets" and "The Energy World Is Flat" as well as "Escape From the Central Bank Trap". Daniel Lacalle (Madrid, 1967). PhD Economist and Fund Manager. Frequent collaborator with CNBC, Bloomberg, CNN, Hedgeye, Epoch Times, Mises Institute, BBN Times, Wall Street Journal, El Español, A3 Media and 13TV. Holds the CIIA (Certified International Investment Analyst) and masters in Economic Investigation and IESE.

Gazprom-CNPC deal

Gazprom deal
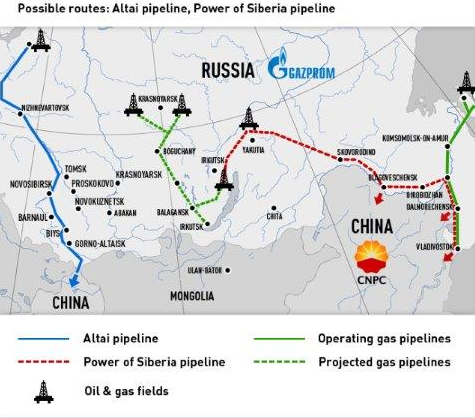
Map courtesy of Gazprom

Conditions:

30 year agreement to start in 2018

38bcm of Russian gas to be delivered to China annually (25% of Chinese demand)

Price: Estimated $350-400/mcm. The formula pricing (oil and a basket of oil products)

Capital Expenditure: $75bn (China’s share $20bn) – includes development of Chayanda and Kovykta fields; and construction of a 2,500-mile pipeline, a petrochemicals complex and a helium plant

Prepayment: $25bn (yet to be confirmed)

The estimated price of the Russia-China contract is $9.75/mmbtu (only $0.95/mmbtu higher than long term Europe contracts). This means that E.On, RWE and GSZ will find it difficult to lower their gas price-offtake agreements in the negotiations of their contracts with Gazprom.

The two sides were not actually negotiating a specific price per unit of gas, but rather a ratio of gas to oil prices. The numbers above likely assume prevailing oil prices, and actual realized prices over the course of the contract could vary significantly depending upon oil markets (according to Citi).

The contract signed targets a nominal volume of 38bcm. However, volumes could be expanded to 60bcmpa later on

Citi estimate the IRR of the project at 4.4% on an ungeared basis and 4.8% assuming 50% project gearing, lower than either Gazprom or Petrochina’s cost of capital, thus generating a negative NPV.

Important Disclaimer: All of Daniel Lacalle’s views expressed in his books and this blog are strictly personal and should not be taken as buy or sell recommendations

Nickel prices soar with Indonesia ban and Russia sanctions risk

nickel

Nickel prices are up 33% YTD following the introduction of a ban on ore exports from Indonesia in early January.

This ban is unlikely to be lifted until 2015, according to analysts. However, the higher the Nickel price, the more likely it is to see it lifted. According to David Wilson at Citigroup “removing the Indonesian flow would be similar to removing Saudi Arabia from the oil market”.

The top nickel producers are Philippines and Indonesia both at c440,000 mt, followed by Russia.

The Ukraine crisis impacts the third largets nickel producer, Russia. Within Russia, Norilsk Nickel is “the single-largest producer of the metal, and group production of 285,000 tonnes last year accounted for more than 15% of the global total”, according to The Wall Street Journal. Therefore, the risk of sanctions on this company alone would shift the supply-demand dynamics of the market rapidly.

Although supply from Russia has not been cut, it poses new risks on a market where demand is not strong, but supply cuts can rapidly move to create a very tight situation.

Nickel demand has been poor in recent years -virtually flat, +0.6% pa 2003-2009, and up small between 2009 and 2013. Last year, stainless steel output rose 3.5%, helping improve the picture.

Growth in demand remains fully dependent on China. An expected 4.9% to 2020 pa growth is supported exclusively by Asia and considering the current revisions of Chinese GDP from +8.2% to +7.4% by the OECD, this demand growth is likely to be brought down.

Inventories, as the graph shows, have not moved drastically despite the massive price increase, which means that the physical market is comfortable despite the Indonesia ban. At the end of March 2014, China had over 20Mt of nickel ore stockpiled.

Many traders see the current $18k Nickel price as temporary because once prices increase dramatically Indonesia would lift the ban to benefit from better prices. However, the market can move from a 140kt global surplus in 2013 to a balanced market, or even a deficit in 2014. Indonesia alone moves this deficit one way or the other, but the combination of Russian sanctions risk and the Indonesia ban makes the balance extremely fragile.

The Return Of Big Oil (CNBC Interview)

The recent outperformance of the integrated oil sector has been quite amazing. It is one of the best performing sectors year-to-date.

The past five years have been disappointing for investors, as the sector underperformed due to weak growth, Return On Capital Employed falling from 28% in 2007 to 13% in 2013 and various mega project delays. Focusing back on profitability and sustainable growth is part of the re-rating process. Continue reading The Return Of Big Oil (CNBC Interview)

US: The Weakest Jobs Recovery On Record

02/05/2014

US unemployment rate is at 6.2%…. or is it?

The US Labor Force plunged -806k to 155.421 million, up just +0.04% Y/Y (+0.73% Y/Y prior).

Most importantly, those Not in the Labor Force surged +988k to 92.018 million, which is the highest on record.

The Workforce Participation Rate fell to 62.81% in April (63.18% prior), the lowest since 1978.

The (U-6) “real” unemployment rate is 12.3%. (Source Boenning & Scattergood, US jobs data)

Additionally, according to the Bureau of Labor Statistics, 20% of all families in the United States do not have a single member that is employed.   62% of all Americans make $20 or less an hour at this point. The number of Americans receiving benefits from the federal government each month exceeds the number of full-time workers in the private sector by more than 60 million.


US fake unemployment


Nominal wage growth is also inexistent:


US wage growth


And no, the difference between unemployment and the decline of labour participation is not explained just by  “demographics” and retirements… at all:

Population participation


Meanwhile, debt reaches record level

Total-Debt-300x199